


Troubleshoot/Identify Memork Usage in explicit/layout/style-sheet-cache/document-shared

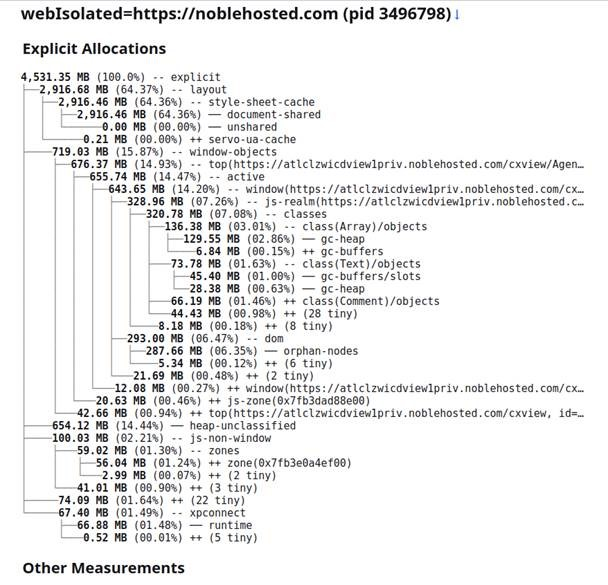
We have an asp.net Blazor SPA (server side Blazor) that dynamically generates components within the page. Over time, there is a very large RAM leak under document-shared that climbs until the windows are closed.
We have tried various firefox configurations to try and either disable this shared storage as well as limit but with no luck. THe memory allocation is in GB of RAM space and cannot be limited or reduced until the window itself is closed/restarted.
Research online indicates this can happen due to colocated stylesheets and how firefox wants to cache styles aggressively. Adjustments to move stylesheets does not appear to help.
What configurations can I use to help prevent/reduce this high RAM usage? This does not occur in Chrome or Edge, I cannot replicate this well under FireFox for Windows.
Tất cả các câu trả lời (7)
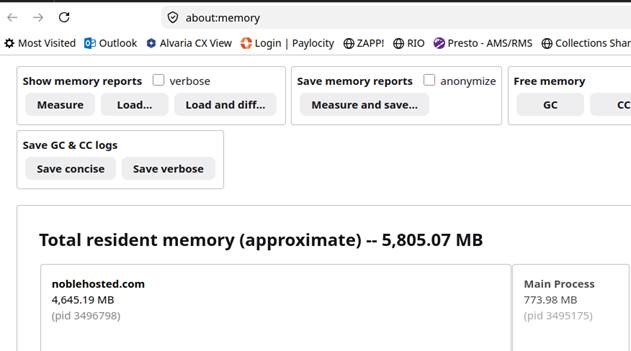
Uploading additional image (memory report and details).
What i"m looking for is an idea of why this is happening but moreover ideas of how I can isolate or restrict this behavior?
We have tried running FireFox in safemode and with all extensions disabled, no luck.
We have tried setting options to restrict cache usage RAM/Disk as well as attempt to disable via below with no difference in behavior.
layout.css.shared-memory-rules.enabled false browser.sessionhistory.max_total_viewers 0
Question: Where can I look in Firefox to analyze what it is caching in shared-documents? What I can I do to enforce that cache flushes over time without completley closing the window?

Can you try with Firefox Beta / Nightly? I believe this should be fixed (https://bugzilla.mozilla.org/show_bug.cgi?id=2007841)
That said, in order to end up with such a massive cache, the application is probably doing something suboptimal like incrementally building inline styles in a very inefficient way (like `style.textContent += "something";` or so).
I will ask them to try beta/nightly to see if the problem continues. Our application uses dynamic components so we are generating controls in a SPA application over time. There are a handful of inline styles but are not unbound but none of which would equal the shear size of RAM being allocated. Almost as if there are detached DOM elements or the like being kept in memory as this renders different pages.
How can I best troubleshoot "what" in being held in RAM for this shared-documents collection? If I can see what is being held vs. something being held. The memory captures just tell me the RAM allocations, not contents of the heap.
Are there any firefox configurations I can set that could minimize or restricted this shared-documents? I found a few online but they do not appear to take any effect (as mentioned above).
Upgrading and testing the nightly build seems to have had a major impact/improvement upon this (version:firefox-beta_153.0b1~build2_amd64.deb).
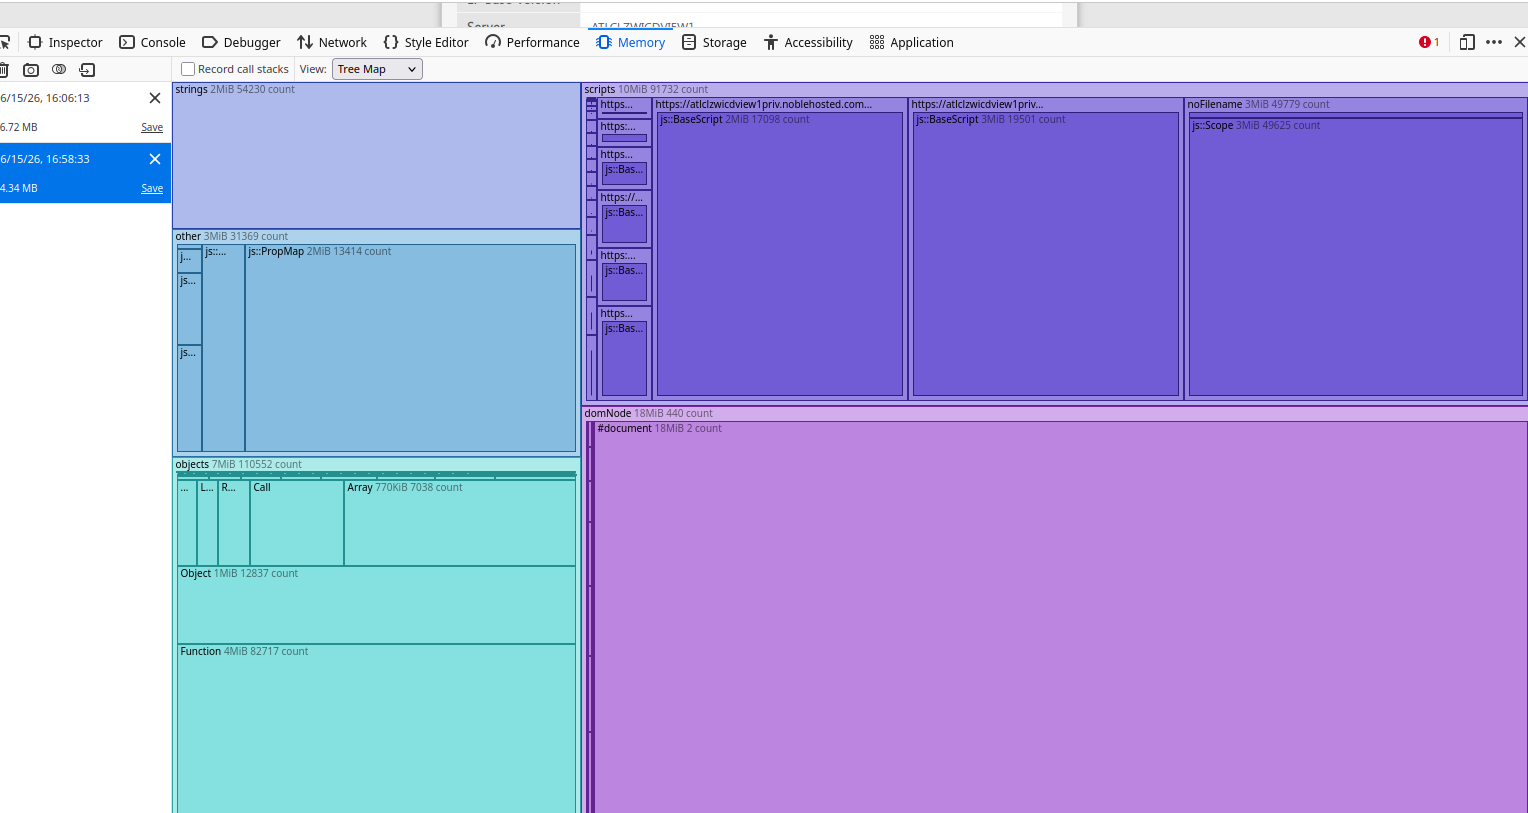
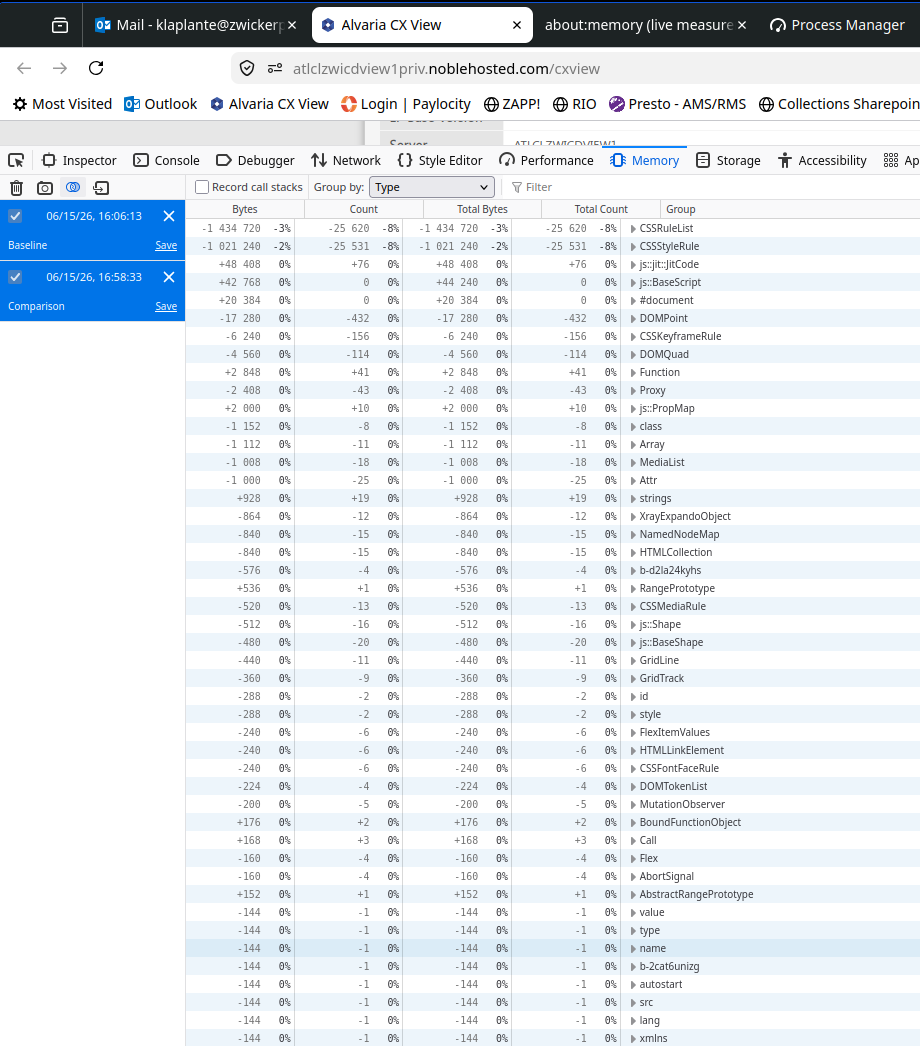
Still reporting growth but at about 1/3 of what was previously been seen (see attached memory capture and snapshot). There remains growth that is unexplained in my opinion. There is no detached DOM elements that I can see and/or any alterations of config options does not appear to have any effect.
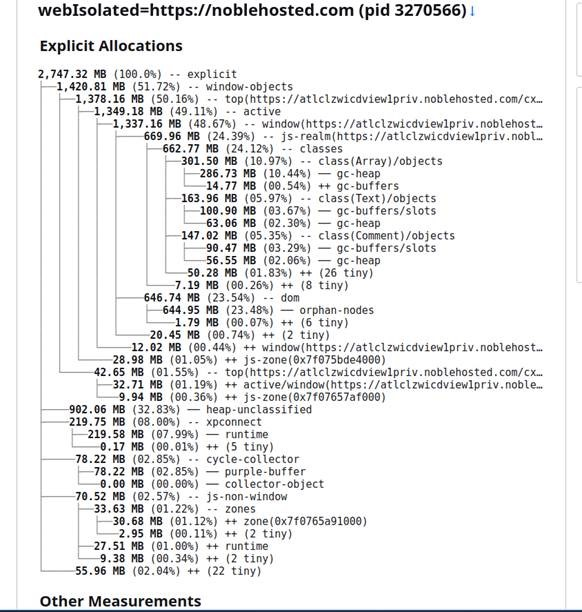
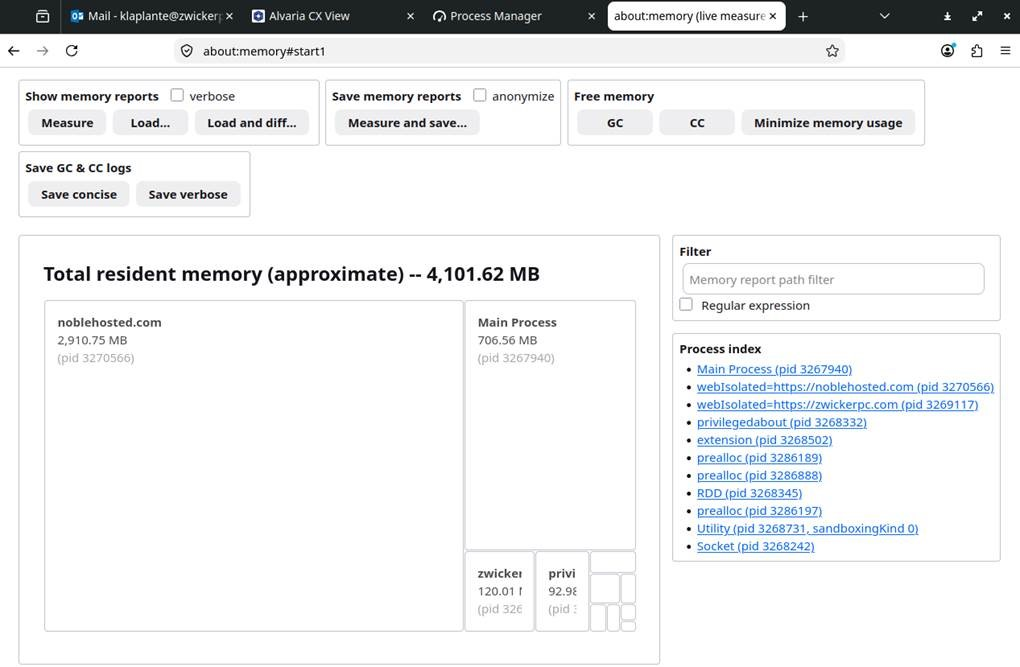
There are a few colocated CSS in dynamic components that would result in what I would expect to be a minimal increase in sizing BUT no where near the size of allocations being shown at site. How best can we troubelshoot and identitfy "what" is in this RAM storage so we can see for ourselves? The snapshot heap allocations do not indicate any leaks and remains in terms of MB in size, not GB, only "share-documents" is what appears to be growing over time.