Can't customize Developer Tools dark-theme
Fx 64.0 release, Linux Mint 18.1
Looked at cor-el's code to help a user increase contrast in Developer Tools / Browser Toolbox. https://support.mozilla.org/en-US/questions/1239355#answer-1169930 I tried it - copied just as cor-el showed & also straightening the code a bit. None of several tweaks worked. My fingers are worn out & my sight is failing fast.
@-moz-document url-prefix(chrome://devtools/content/) {
body * , .CodeMirror-line *, #output-container {
  font-size: 12px !important;
  font-weight: bold !important;
  background-color: black !important;
  color: #E8E8E8 !important }
.devtools-tab *,.splitview-nav > li *{
  font-size:12px !important;
  background-color: black !important;
  color:#E8E8E8 !important}
.devtools-tab.selected *{
  font-weight:bold !important;
  background-color: black !important}
.tab-panel-box .inspector-tabpanel {
  font-size:12px !important;
  font-weight:bold !important}
.splitview-nav > li.splitview-active *{
  font-weight:bold !important} }
I wonder is something's changed in a new Fx version or 2 (since 11/04/18) that broke cor-el's code? I tried it in regular Fx 64 & in Tor Browser that uses Fx 60.4esr. The "dark-theme" colors are the same in both those Fx versions (washed out). I tried putting it above the @namespace line, as mentioned, and below it - neither worked.
I see in developer tools dark-theme.css file, the selector is ".theme-body", not "body":
.theme-body {
 background: var(--theme-body-background);
 color: var(--theme-body-color);
(that's from dark-theme.css, not what I put in userChrome.css.
Also, I'm not clear on the path to use here: @-moz-document url-prefix(chrome://devtools/content/) {, as I've never styled any chrome elements. I saw one honking big devtools theme somewhere. I think they just used "(chrome://devtools/content/)" - (no quotes) for the 1st line. Changing the 1st line to that didn't work either.
Are we sure about the path to enter, //chrome/devtools/content/? I guess it depends on whether it needs to reference the folder (in omni.ja) that holds the sub-folders for all the tools (Inspector, Debugger, etc.) - which is /chrome/devtools/content/ (in Tor Browser / Fx 60.4esr).
If the path shown in the 1st line needs to be the folder that holds all the css & the dark-theme.css files, then it's "/chrome/devtools/skin/." I only tried the /chrome/devtools/content. Thanks.
Ndryshuar nga JoeB
Krejt Përgjigjet (6)
This sort of went south. After rebooting the pc overnight, there's a new twist on devtools colors. It depends on HOW the tool(s) are opened.
If I open one tool - like Browser console - using Ctrl+Shft+J (either in Firefox or Tor Browser, aka, TBB), the entire devtool UI is pure black BG & white text. It's never done that before & I don't have white text (color: white) entered in the userChrome code - from cor-el. I'm not using a high visibility theme in Linux or anywhere, AFAIK. I've never seen this black / white behavior until added cor-el's devtools code to userChrome & cold booted. Same black / white if open "Web console" using Ctrl+Shft+K. Web Console also shows all other devtools (e.g., Inspector, Debugger, etc.) as in Browser Toolbox. Not blaming - just giving info.
Maybe the devtools is defaulting to black & white (IF... tools are opened using specific way / shortcut) because it doesn't like the userChrome code? However, if open Browser Toolbox w/ Ctrl+Shft+Alt+I - OR use the menu, THEN it uses the default dark-theme coloring in all panes, all tools - as before attempting to modify devtools dark theme. Browser Toolbox shows ALL SAME tools as Web Console.
OK, little help? Good news: got the background = black - under certain conditions; removed color: properties. I put this code in empty userChrome.css - by itself - no @namespace line.
@-moz-document url-prefix(chrome://devtools/content/) {
body * , .CodeMirror-line *, #output-container {
  font-size: 12px !important;
  font-weight: bold !important;
  background-color: black !important;
   }
.devtools-tab *,.splitview-nav > li *{
  font-size:12px !important;
  background-color: black !important;
 }
.devtools-tab.selected *{
  font-weight:bold !important;
  background-color: black !important}
.tab-panel-box .inspector-tabpanel {
  font-size:12px !important;
  font-weight:bold !important}
.splitview-nav > li.splitview-active *{
  font-weight:bold !important}
}
Bad News: starting Browser Toolbox - either thru menu or Ctrl+Shft+Alt+i, it doesn't apply the userChrome code. It still uses the standard devtools dark theme.
If I start Web Console Ctrl+Shft+K, then it uses the userChrome edits, and all the other devtools are in the toolbar. BUT... using Ctrl+Shft+K, where the UI is modified, it's unable (anymore) to inspect any Fx toolbars, tabs, Nav bars, etc., even though the Inspect tool is there (it will inspect chrome pages).
And when devtools are opened (by Ctrl+Shft+K) and a tab is reloaded or new site loaded, devtools closes instantly. I assume there's a bug or need a cold boot.
So I improved devtools UI in some instances, but introduced a couple of unacceptable problems. Any ideas how to find what's causing the new problems?
Hello joebt,
I've asked somebody to take a look at your thread .....
The Browser Console and the other developer tools (Web Console and Inspector; i.e. chrome://devtools/content/) are different components. The Browser Toolbox uses its own profile (chrome_debugger_profile) and is accessed via a remote connection and won't respond to any code in userChrome.css You would probably have to create a chrome folder and userChrome.css file in this chrome_debugger_profile folder to make this work for the toolbox.
You can use the toolbox to check CSS code for the regular developer tools.
Thanks cor-el. Hmmm. Bear w/ me, cause I suspect others may want info on this. For the devtools OTHER than starting Browser Toolbox, just making fonts bold & slightly larger, making backgrounds BLACK in Web Console / Style Editor, etc.,, makes a big difference in readability. So thanks for that.
Correct me if wrong. The only tool (in the "devtools" universe) that can inspect browser toolbars ( navbar / toolbars & all buttons, icons on them, etc.) is "Browser Toolbox"? By now there may be 3rd party addons that customize Browser Toolbox's UI - if web extensions are allowed. Stylish can no longer change the browser UI.
You're saying possibly create a (separate) chrome folder & another userChrome.css file to put in the "chrome_debugger_profile", that's a sub-folder of the working Fx profile?
Have you ever tried code like this in a chrome_debugger_profile/chrome/userChrome.css file to alter the Browser Toolbox UI?
"You can use the toolbox to check CSS code for the regular developer tools."
How do you mean, exactly? There are a couple of things I can think of, but not sure of the extent of usefulness or capability.
If anyone looking at this doesn't want all white text (everywhere in devtools), they'll need to remove any properties for "color:white" in userChrome.css code to style devtools, or else all syntax coloring becomes white.
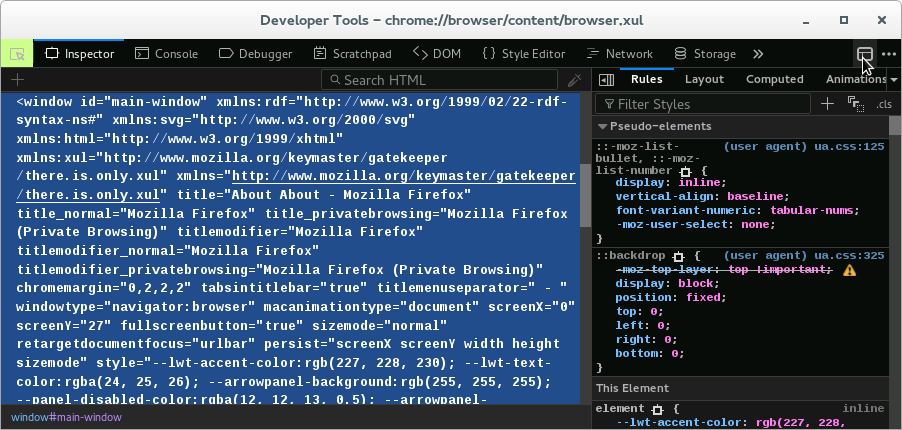
There is a button on the toolbar of the developer toolbox to select frames. This button opens a list with all available windows and that includes to windows from the developer tools. You may have to enable this button via the settings page (F1).
I've create a separate chrome folder in the chrome_debugger_profile folder like I wrote above and code in userChrome.css works as expected.
See also Targeting a document: