

This thread was archived.
Please ask a new question if you need help.

Archived
firefox cannot show ext charting .

Hi team,
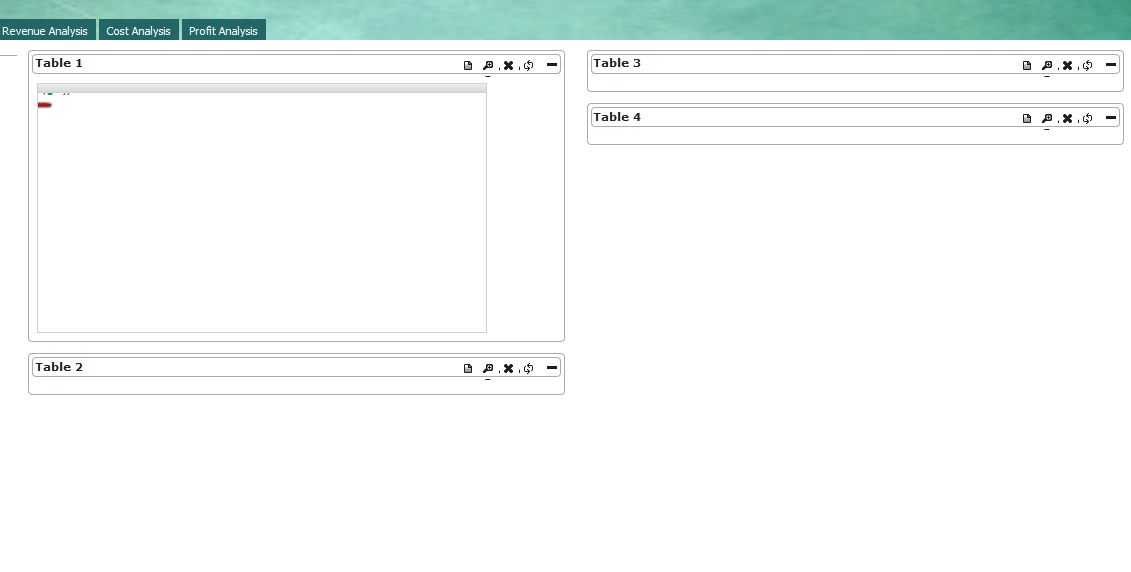
I am using ext net charting into my MVC PROJECT,when debugging (tool:VS 2013), only firefox cannot show the charting, IE and chrome run okay. could you advise it?
thanks in advance.
part coding as below:
// I put the chart into jquery portlet , only portlet can be showed, but the chart which should be put into content of the portlet cannot be presented.
Table 4
// BELOW IS THE CHART
                                   @(X.Panel()
       .Title("Column Chart")
       .Layout(LayoutType.Fit)
                .Width(450)
                .MinWidth(100)
                .MinHeight(70)
                .Height(250)

       .Items(
           X.Chart()
               .ID("Chart5")
               .Shadow(true)
               .StyleSpec("background:#fff;")
               .Animate(true)
               .Store(X.Store()
                   .Data(Model)
                   .Model(X.Model()
                       .Fields(
                           X.ModelField().Name("Name"),
                           X.ModelField().Name("Data1")
                       )
                   )
                   .Proxy(X.AjaxProxy()
                       .Url(Url.Action("GetData"))
                       .Reader(X.JsonReader().Root("data"))
                   )
               )
               .Axes(
                   X.NumericAxis()
                       .Fields("Data1")
                       .Grid(true)
                       .Title("Number of Hits")
                       .Minimum(0)
                       .Label(X.AxisLabel()
                           .Renderer(r => r.Handler = "return Ext.util.Format.number(value, '0,0');")
                       ),
                   X.CategoryAxis()
                       .Position(Position.Bottom)
                       .Fields("Name")
                       //.Title("Month of the Year")
               )
               .Series(X.ColumnSeries()
                   .Axis(Position.Left)
                   .Highlight(true)
                   .XField("Name")
                   .YField("Data1")
                   .Tips(X.ChartTip()
                       .TrackMouse(true)
                       .Width(140)
                       .Height(28)
                       .Renderer(r => r.Handler = "this.setTitle(storeItem.get('Name') + ': ' + storeItem.get('Data1'));")
                   )
                   .Label(X.SeriesLabel()
                       .Display(SeriesLabelDisplay.InsideEnd)
                       .Field(new[] { "Data1" })
                       .Orientation(Orientation.Horizontal)
                       .Color("#333")
                       .TextAnchor("middle")
                       .Renderer(r => r.Handler = "return Ext.util.Format.number(value, '0');")
                   )
               )
       )
                                   )
// CHART END
Hi team,
I am using ext net charting into my MVC PROJECT,when debugging (tool:VS 2013), only firefox cannot show the charting, IE and chrome run okay. could you advise it?
thanks in advance.
part coding as below:
// I put the chart into jquery portlet , only portlet can be showed, but the chart which should be put into content of the portlet cannot be presented.
<div id="effect4" style="display:none" class="portlet">
<div class="portlet-header">Table 4</div>
<div class="portlet-content">
// BELOW IS THE CHART
@(X.Panel()
.Title("Column Chart")
.Layout(LayoutType.Fit)
.Width(450)
.MinWidth(100)
.MinHeight(70)
.Height(250)
.Items(
X.Chart()
.ID("Chart5")
.Shadow(true)
.StyleSpec("background:#fff;")
.Animate(true)
.Store(X.Store()
.Data(Model)
.Model(X.Model()
.Fields(
X.ModelField().Name("Name"),
X.ModelField().Name("Data1")
)
)
.Proxy(X.AjaxProxy()
.Url(Url.Action("GetData"))
.Reader(X.JsonReader().Root("data"))
)
)
.Axes(
X.NumericAxis()
.Fields("Data1")
.Grid(true)
.Title("Number of Hits")
.Minimum(0)
.Label(X.AxisLabel()
.Renderer(r => r.Handler = "return Ext.util.Format.number(value, '0,0');")
),
X.CategoryAxis()
.Position(Position.Bottom)
.Fields("Name")
//.Title("Month of the Year")
)
.Series(X.ColumnSeries()
.Axis(Position.Left)
.Highlight(true)
.XField("Name")
.YField("Data1")
.Tips(X.ChartTip()
.TrackMouse(true)
.Width(140)
.Height(28)
.Renderer(r => r.Handler = "this.setTitle(storeItem.get('Name') + ': ' + storeItem.get('Data1'));")
)
.Label(X.SeriesLabel()
.Display(SeriesLabelDisplay.InsideEnd)
.Field(new[] { "Data1" })
.Orientation(Orientation.Horizontal)
.Color("#333")
.TextAnchor("middle")
.Renderer(r => r.Handler = "return Ext.util.Format.number(value, '0');")
)
)
)
)
// CHART END
</div>
</div>
All Replies (2)
the page showed this.
any update, team