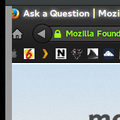
Vertical colored bars on left side of window?
Arch Linux, 64-bit
Radeon HD 7750 w/ Mesa 10.6.4
Gnome 3.16.2
Firefox 40.0.2 (problem does not occur on FF 39.0.3)
Any Firefox window has a colored vertical region (20-or-so pixels wide) beginning just under the system title bar and extending down to the bottom of the FF window. The region begins as a single color(1) but then, as the viewport changes(2) this region is segmented into sub-regions of independently varying colors. Multiple windows maintain their own independent colored region.
If multiple firefox windows are opened, each has its own region. Context menus (e.g. right clicking anywhere in the FF window) also have such a region. Disabling all extensions, plugins, and themes has no effect.
(1) The colors I've observed are always fundamental (cyan, magenta, yellow, green, blue, red, gray). When the color is set or changed (described below) the color seems to be set at random - that is to say I cannot distinguish a pattern as to how
(2) Scrolling the viewport or invoking a browser modal/prompt/file dialog will cause the entire region to change to one other color. Certain (I can't nail down the rhyme or reason) block-level changes to a page will cause a sub-region to appear, horizontally aligned with said block. Page-wide changes "reset" these sub regions. Animations on the page causing color changes (such as the fading in of a modal overlay div or the slow sliding up of the Firefox address bar when entering fullscreen) will cause rapid color change during the period of animation/transition. Blurring the Firefox window or using the PrintScreen button will also reset the entire region back to one color so I'm unable to get a screengrab of varying subregions.
Is this a problem with Firefox? Where should I file a bug report? Mozilla? Gnome? X? Mesa?
Modified
Chosen solution
Just wanted to post an update. I once again revisited this issue to try to figure out what the problem was (this time with v44.0).
Again, no change of settings resolved the issue, nor did disabling extensions and themes.
However, this time, a newly created profile did not show the behavior. To this new profile I installed all of my extensions and themes, configured my custom settings, and I have not seen the problem return for days now.
Not sure what happened here. The update from v39 to v40 (with no other changes) introduced this strange artifact, which at first was not solvable with a new profile, but now is. I'm at a loss.
Read this answer in context 👍 0All Replies (10)
check this:
- see if there are updates for your graphics drive drivers
https://support.mozilla.org/kb/upgrade-graphics-drivers-use-hardware-acceleration
- disable protected mode in the Flash plugin (Flash 11.3+ on Windows Vista and later)
https://forums.adobe.com/message/4468493#TemporaryWorkaround
- disable hardware acceleration in the Flash plugin
https://forums.adobe.com/thread/891337 See also:
Drivers are fully patched (again, this problem does *not* occur on FF 39.0.3) and Flash is disabled.
Start Firefox in Safe Mode {web Link} by holding down the <Shift>
(Mac Options) key, and then starting Firefox. Is the problem still there?
Try to toggle the gfx.xrender.enabled pref on the about:config page.
You can open the about:config page via the location/address bar. You can accept the warning and click "I'll be careful" to continue.
@FredMcD Yes, the problem is still there. Again, "Disabling all extensions, plugins, and themes has no effect. " (and that includes safe mode)
@cor-el bad advice - that caused Firefox not to render anything other than the title bar. Completely blank white canvas. I had to edit prefs.js to reset this before the browser was usable again.
You mentioned a prefs.js file. Are there any customization other than what has been mentioned?
@guigs - this problem persists in a clean new FF profile, in Safe Mode, so it's nothing to do with configuration.
I had a thought, and fired up Firefox Developer Edition (42.0a2, 2015-08-21) which does not exhibit this behavior.
I think it's safe to assume this is a bug of some sort, as the most recent update was the only change made between a working state and this.
I'm less interested in troubleshooting and more interested in filing a bug report. Per my initial request, I'm just trying to figure out where to file.
Chosen Solution
Just wanted to post an update. I once again revisited this issue to try to figure out what the problem was (this time with v44.0).
Again, no change of settings resolved the issue, nor did disabling extensions and themes.
However, this time, a newly created profile did not show the behavior. To this new profile I installed all of my extensions and themes, configured my custom settings, and I have not seen the problem return for days now.
Not sure what happened here. The update from v39 to v40 (with no other changes) introduced this strange artifact, which at first was not solvable with a new profile, but now is. I'm at a loss.
All I will say is, Whatever works, works. That was very good work. Well Done.


