

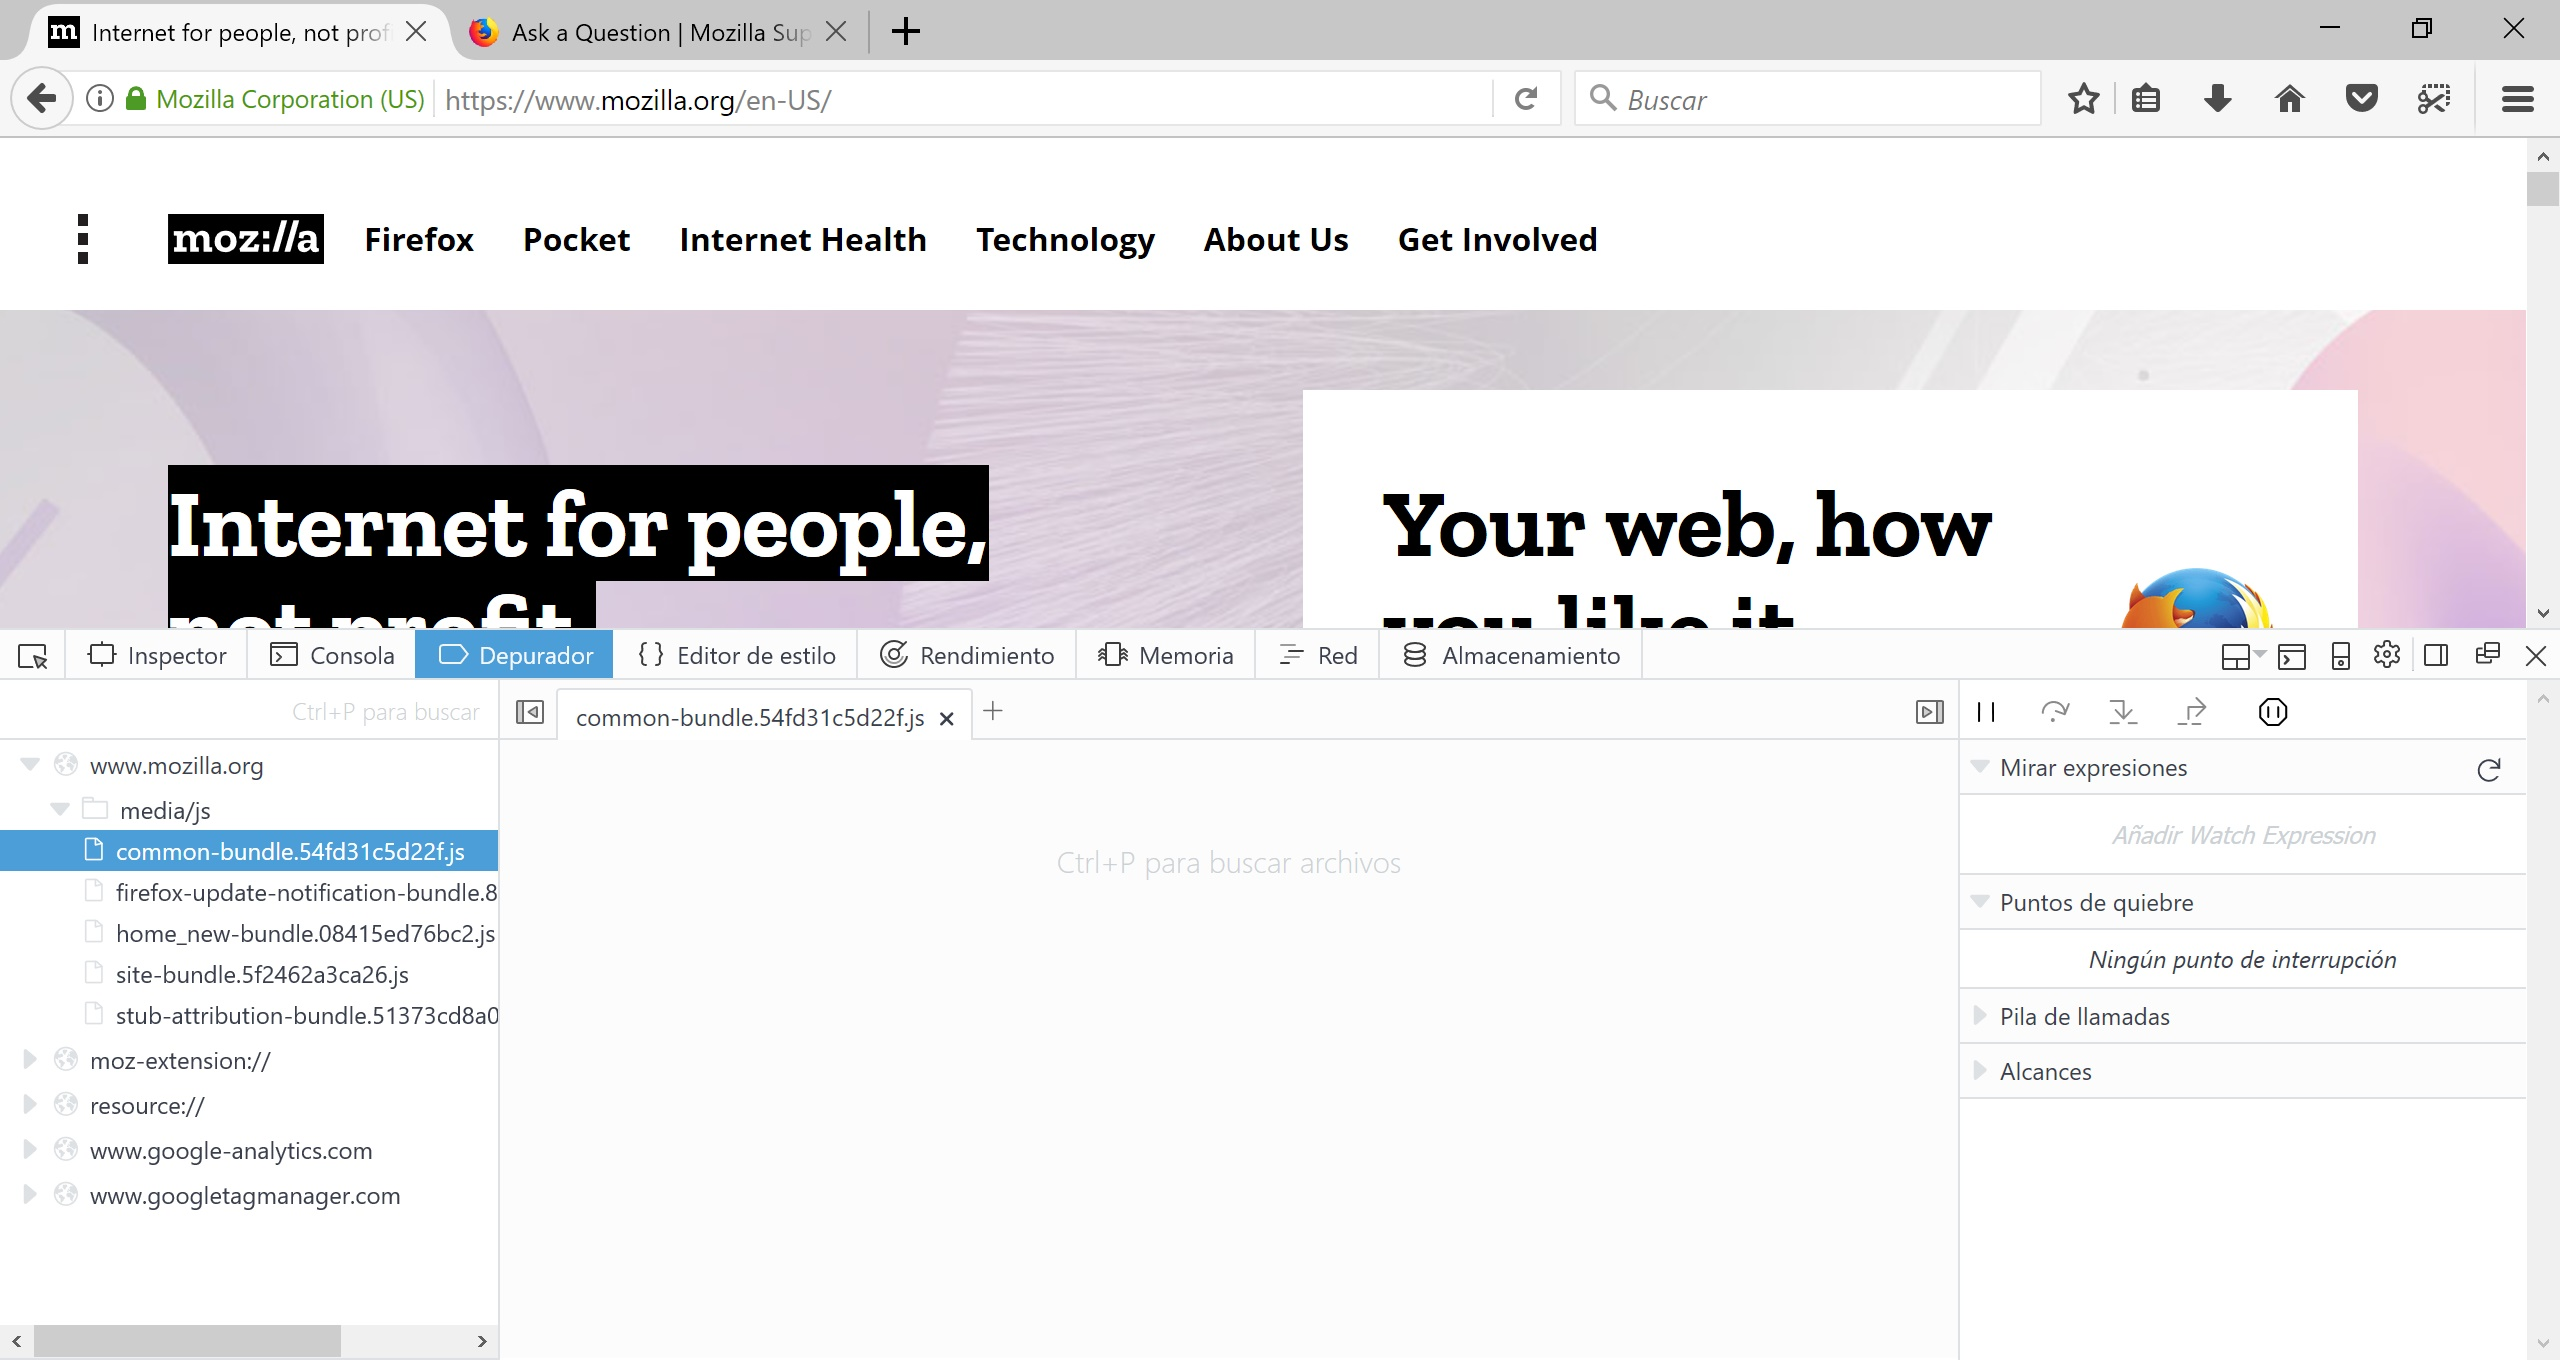
I am not able to see javascript file content in debugger window
I am not able to see any Javascript file content into debugger Window (Developer tools). I am runninf firefox 56.0.2 64 bits in Windows 10 - Creators Update.
josuemb द्वारा सम्पादित
All Replies (8)
I think I have seen reports of this where the user said they had to exit out of Firefox and restart to get the debugger to start showing script content again. Not a very convenient workaround, but if you don't get any other solutions, perhaps worth a try.
Thanks in advance for your help. This issue is persistent accross the time, this is: if i restart Firefox the problem persists even when I reinstalled firefox. As a temporary solution I am using Firefox Developer Edition to do the same and it works.
Any specific error messages about this issue in the Browser Console?
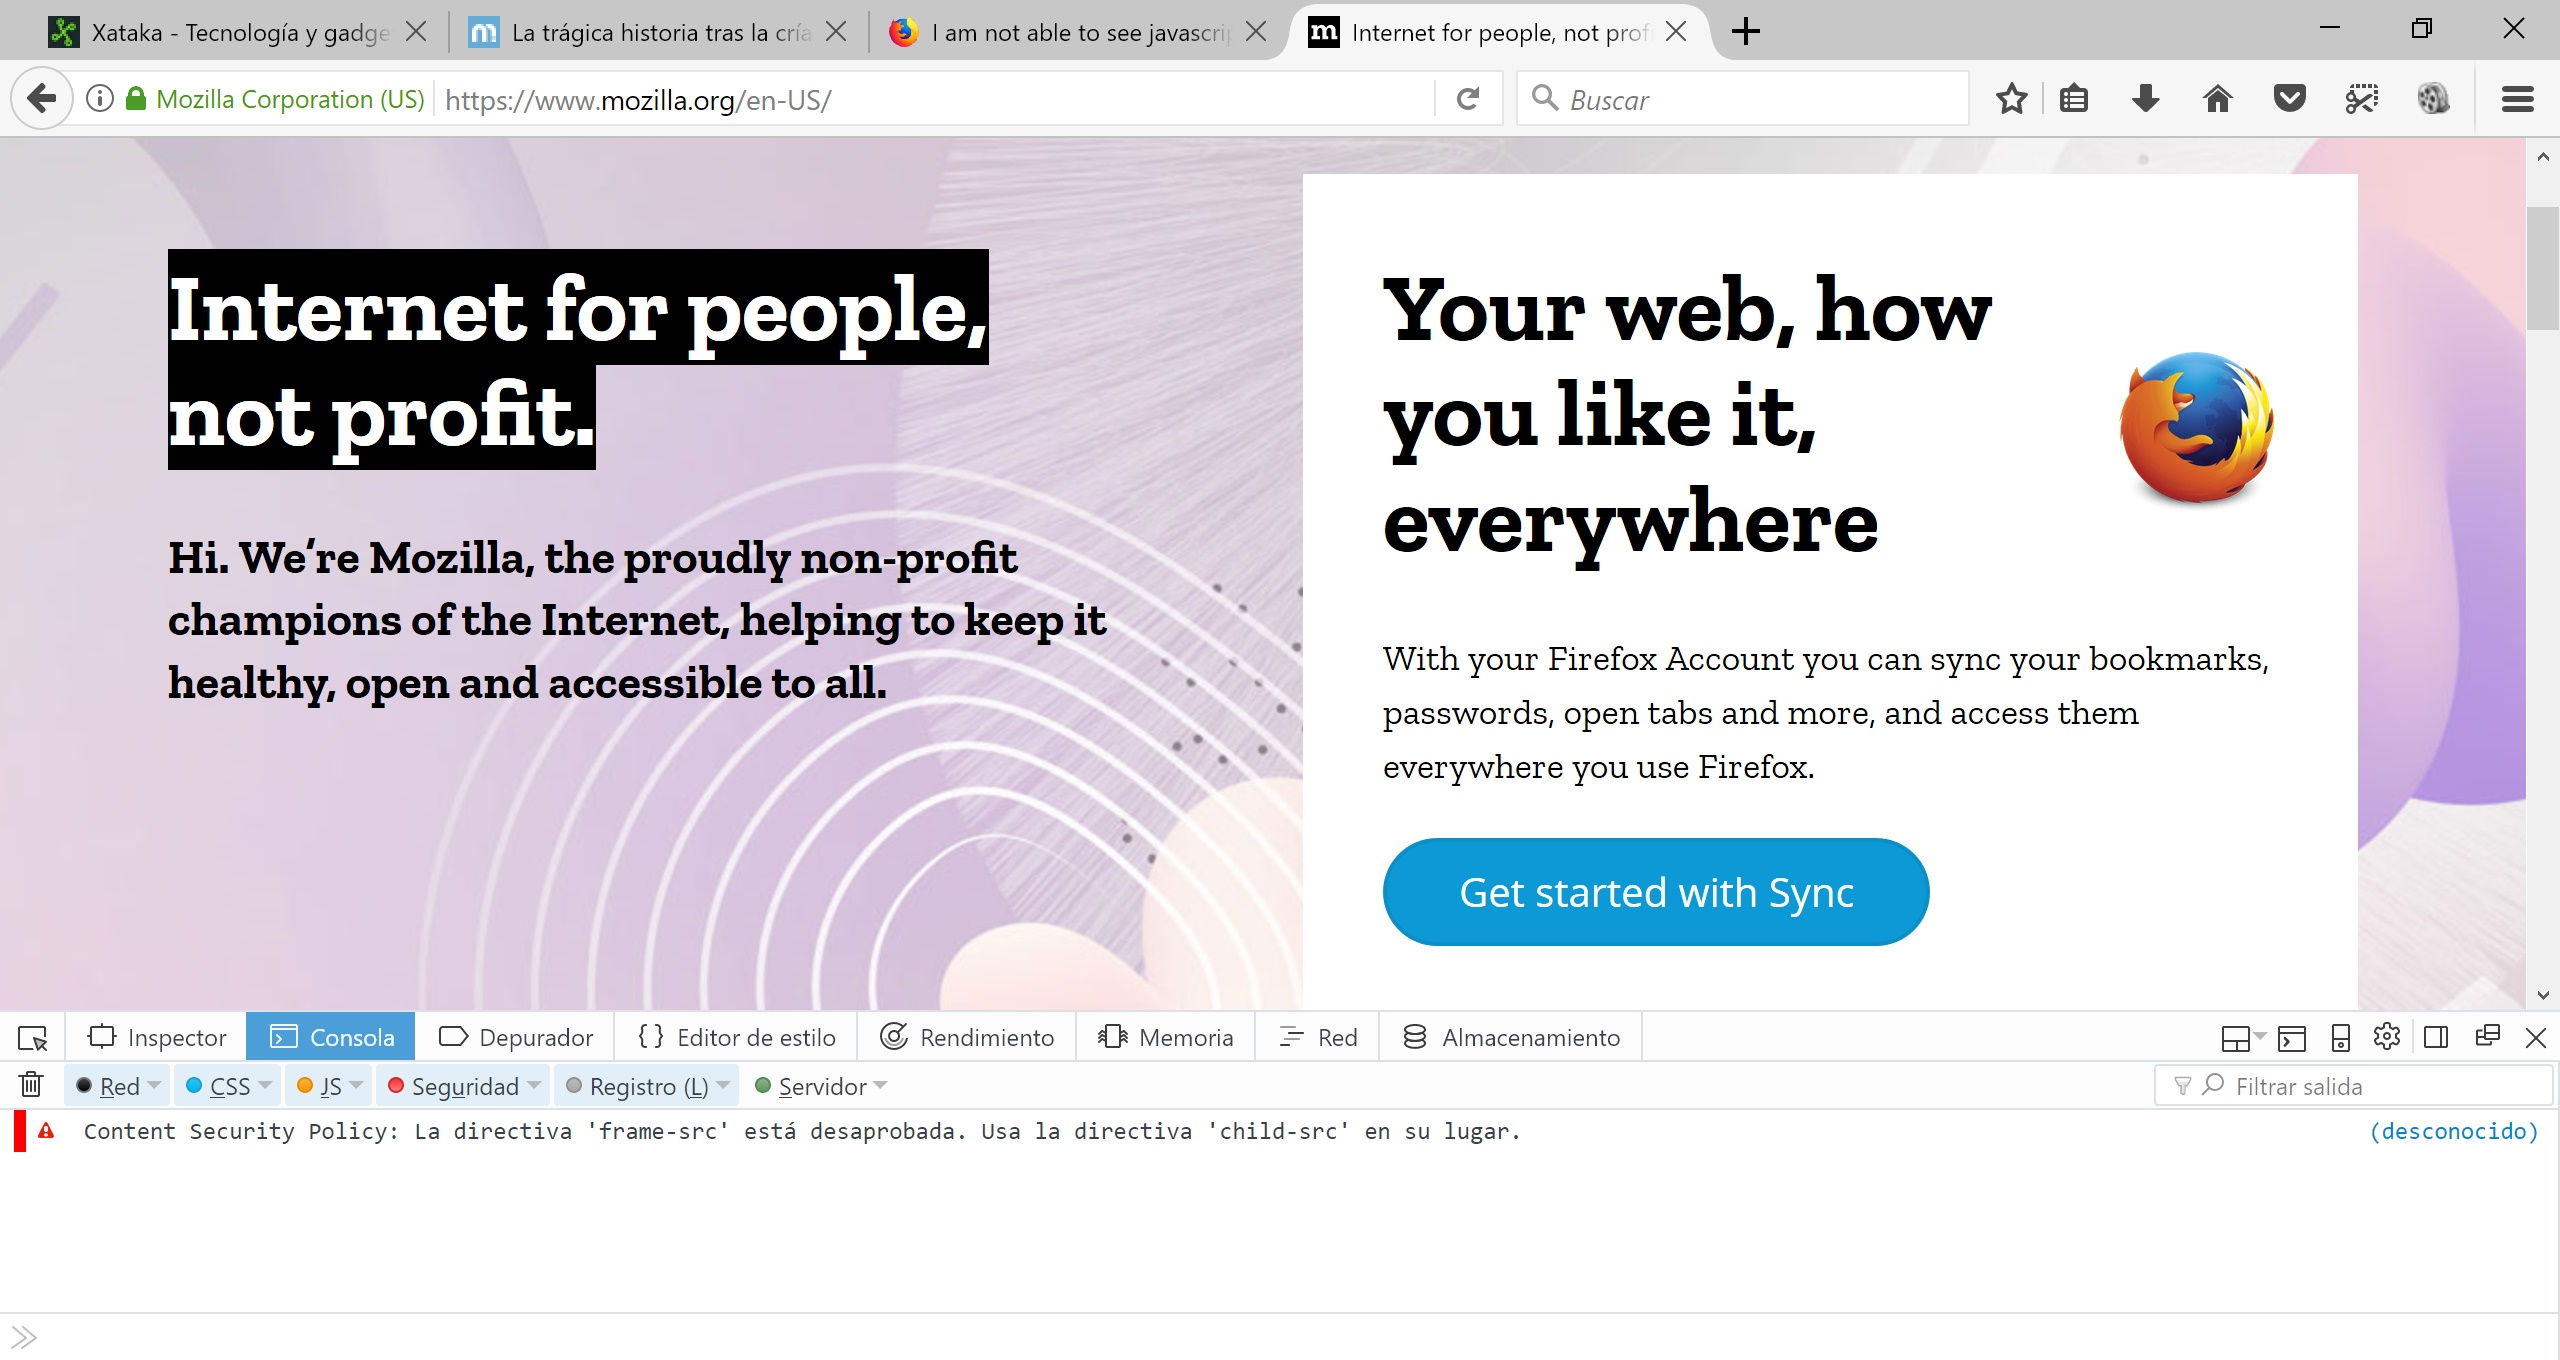
Nothing could affect. See attachment.
I think that your screenshot shows the Web Console and not the Browser Console like I asked above. The Web Console only shows messages about the page in the current tab. The Browser Console shows messages from all tabs and also shows messages about problems with extensions and internal Firefox code.
cor-el द्वारा सम्पादित
Corel is right, there is a way to show if there is something blocking the script from loading in the debugger if you can show a screenshot fo the Browser console when you reload the page?
Corel do you think it is a cache issue?
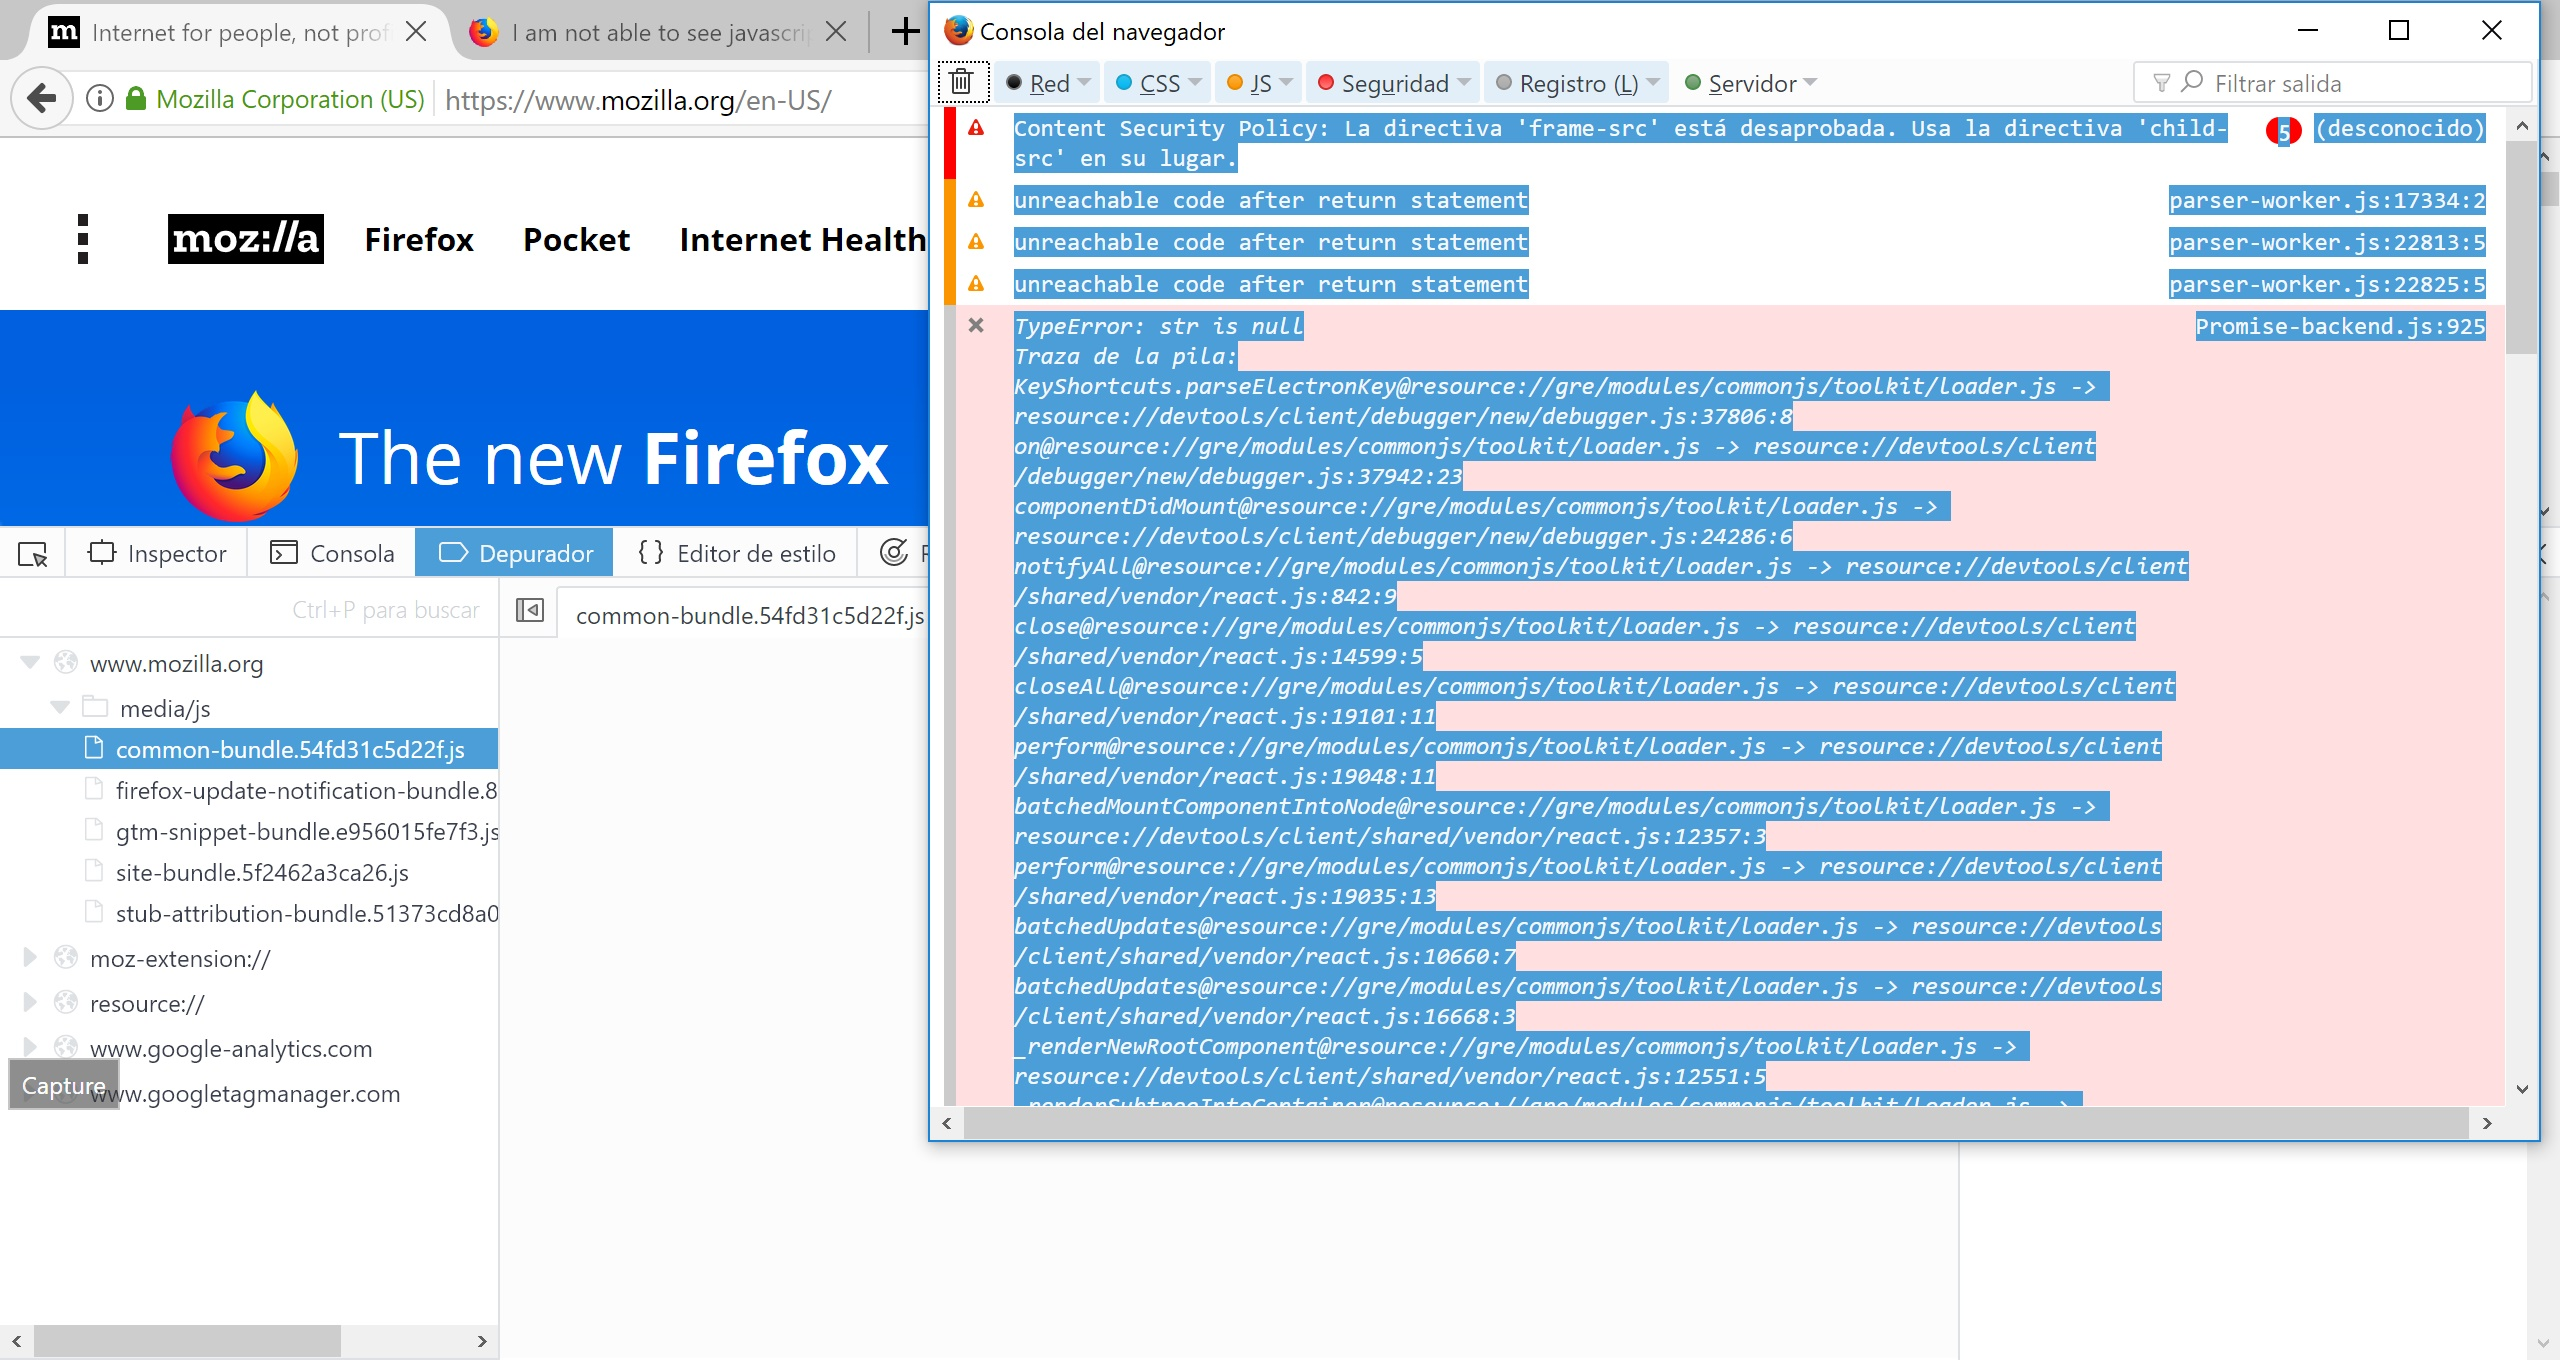
I am sorry for the mistake I am putting the sreenshoot with webconsole opened. Thetext in the console is:
(looks lik a bug in parserworker.js as far as I seee)
Content Security Policy: La directiva 'frame-src' está desaprobada. Usa la directiva 'child-src' en su lugar. (desconocido) unreachable code after return statement parser-worker.js:17334:2 unreachable code after return statement parser-worker.js:22813:5 unreachable code after return statement parser-worker.js:22825:5 TypeError: str is null Traza de la pila: KeyShortcuts.parseElectronKey@resource://gre/modules/commonjs/toolkit/loader.js -> resource://devtools/client/debugger/new/debugger.js:37806:8 on@resource://gre/modules/commonjs/toolkit/loader.js -> resource://devtools/client/debugger/new/debugger.js:37942:23 componentDidMount@resource://gre/modules/commonjs/toolkit/loader.js -> resource://devtools/client/debugger/new/debugger.js:24286:6 notifyAll@resource://gre/modules/commonjs/toolkit/loader.js -> resource://devtools/client/shared/vendor/react.js:842:9 close@resource://gre/modules/commonjs/toolkit/loader.js -> resource://devtools/client/shared/vendor/react.js:14599:5 closeAll@resource://gre/modules/commonjs/toolkit/loader.js -> resource://devtools/client/shared/vendor/react.js:19101:11 perform@resource://gre/modules/commonjs/toolkit/loader.js -> resource://devtools/client/shared/vendor/react.js:19048:11 batchedMountComponentIntoNode@resource://gre/modules/commonjs/toolkit/loader.js -> resource://devtools/client/shared/vendor/react.js:12357:3 perform@resource://gre/modules/commonjs/toolkit/loader.js -> resource://devtools/client/shared/vendor/react.js:19035:13 batchedUpdates@resource://gre/modules/commonjs/toolkit/loader.js -> resource://devtools/client/shared/vendor/react.js:10660:7 batchedUpdates@resource://gre/modules/commonjs/toolkit/loader.js -> resource://devtools/client/shared/vendor/react.js:16668:3 _renderNewRootComponent@resource://gre/modules/commonjs/toolkit/loader.js -> resource://devtools/client/shared/vendor/react.js:12551:5 _renderSubtreeIntoContainer@resource://gre/modules/commonjs/toolkit/loader.js -> resource://devtools/client/shared/vendor/react.js:12632:21 render@resource://gre/modules/commonjs/toolkit/loader.js -> resource://devtools/client/shared/vendor/react.js:12653:12 monkeyPatchRender/<@resource://gre/modules/commonjs/toolkit/loader.js -> resource://devtools/client/shared/vendor/react-dom.js:128:14 renderRoot@resource://gre/modules/commonjs/toolkit/loader.js -> resource://devtools/client/debugger/new/debugger.js:3409:6 bootstrapApp@resource://gre/modules/commonjs/toolkit/loader.js -> resource://devtools/client/debugger/new/debugger.js:32502:5 onConnect</_ref<@resource://gre/modules/commonjs/toolkit/loader.js -> resource://devtools/client/debugger/new/debugger.js:31465:7 step@resource://gre/modules/commonjs/toolkit/loader.js -> resource://devtools/client/debugger/new/debugger.js:31491:184 step/<@resource://gre/modules/commonjs/toolkit/loader.js -> resource://devtools/client/debugger/new/debugger.js:31491:362
Promise-backend.js:925
unreachable code after return statement parser-worker.js:17334:2
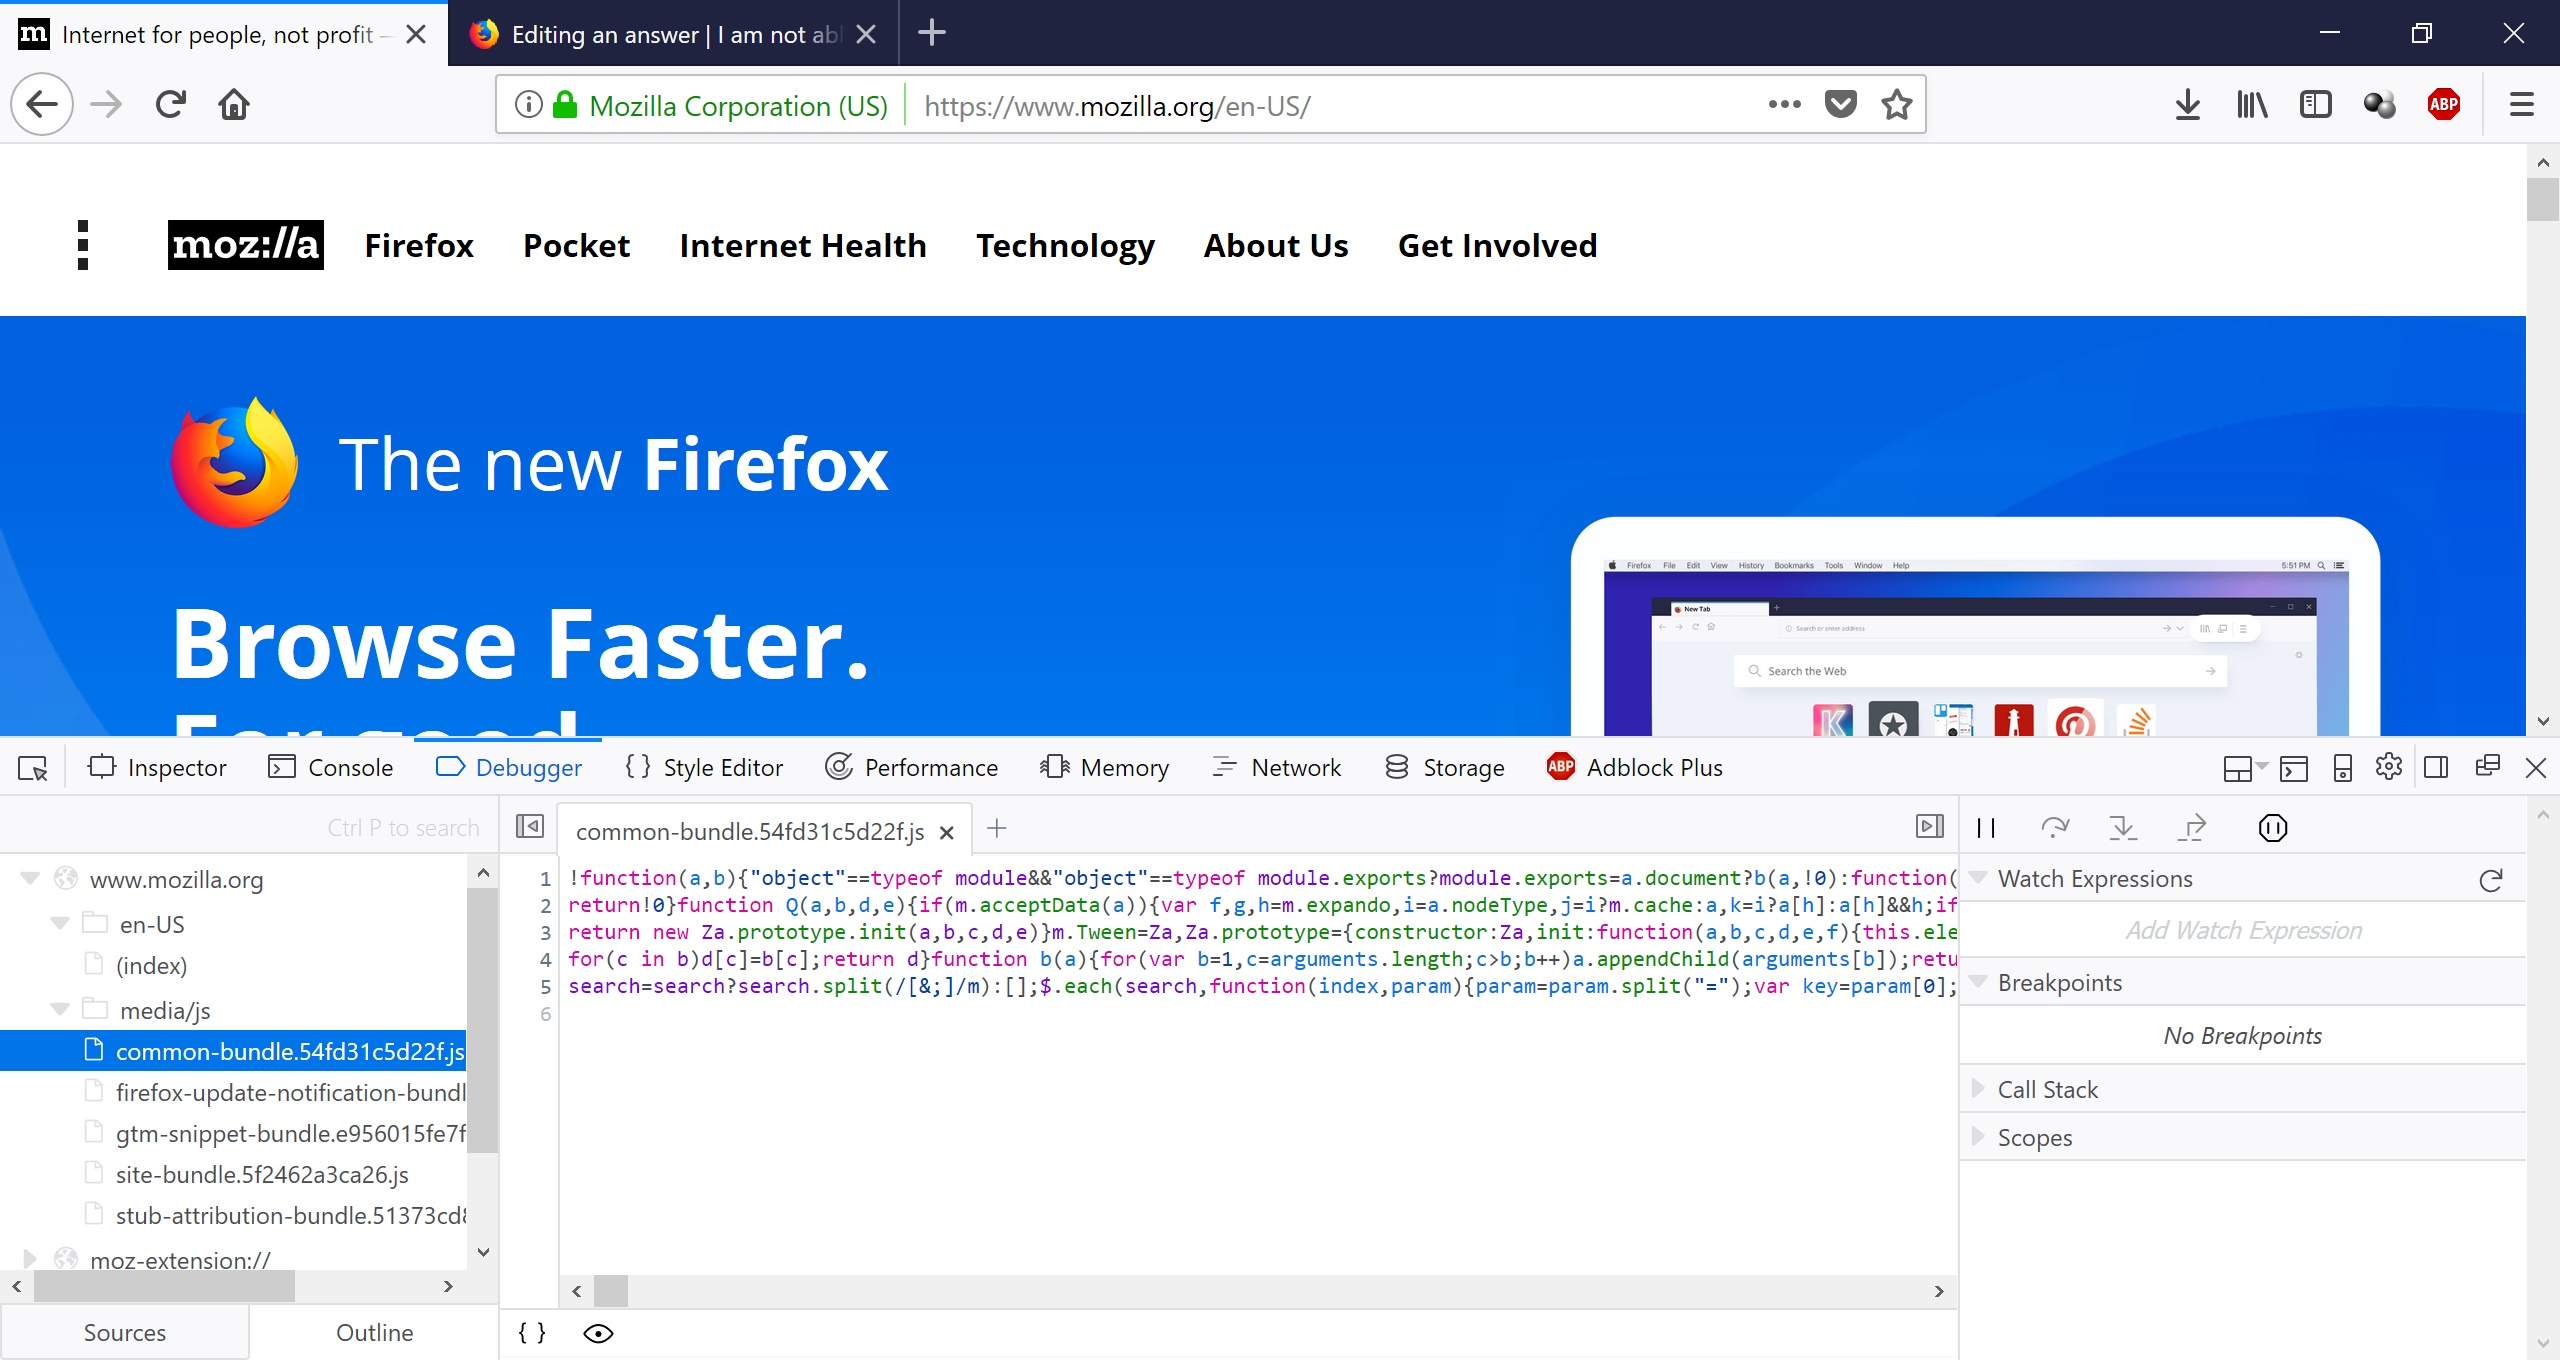
Some updates:
- I updated to Quantum and the problem persists.
- Since I suspected about a localization problem I uninstalled ES-MX version.
- I Installed Quantum Win64 EN-US version, after I tested under this scenario the problem has gone!
I am putting my 20 cents on it: It's a localization-related issue.
I am developer, so count on me if you need some help on this.
Best regards.
josuemb द्वारा सम्पादित