Windows 10 will reach EOS (end of support) on October 14, 2025. For more information, see this article.

Search Support

Avoid support scams. We will never ask you to call or text a phone number or share personal information. Please report suspicious activity using the “Report Abuse” option.

Learn More

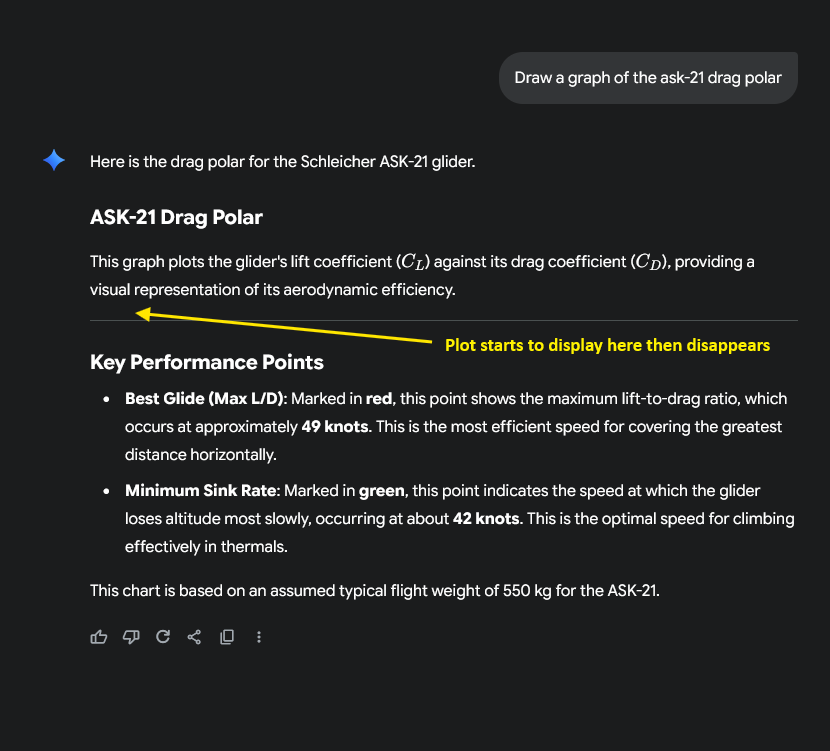
Google Gemini graphs are not displayed in Firefox (actively removed)

  • Babu amsoshi
  • 0 sa na da wannan matsala
  • 15 views
more options

Graphs generated by Google Gemini Pro 2.5 do not display in Firefox. They are generated and then quickly removed from the display by something in Firefox. I am not running any adblocker software or extensions other than anything that is native to Firefox. I have tried changing about everything possible in the privacy settings and have not been able to fix it.

Here is what Gemini says it does when it generates a graph versus a AI generated picture.

Data Visualization (The "Graph") 📊

When you ask me to "graph," "plot," or "chart" data (like a drag polar), I use a Code Interpreter.

My Process: I write and execute Python code using a data visualization library (Matplotlib). This code performs calculations and generates a brand-new chart from scratch.

Why It Fails to Display: The resulting image is a piece of procedurally generated content. The way it's embedded in the page is more complex than a standard image. Aggressive ad blockers or strict browser privacy settings often mistake this type of dynamic content for a pop-up, an ad, or a tracker, and they actively block it from appearing—which is what causes the "appears and then disappears" issue you described.

Any help you can provide would be greatly appreciated. Thanks.

Graphs generated by Google Gemini Pro 2.5 do not display in Firefox. They are generated and then quickly removed from the display by something in Firefox. I am not running any adblocker software or extensions other than anything that is native to Firefox. I have tried changing about everything possible in the privacy settings and have not been able to fix it. Here is what Gemini says it does when it generates a graph versus a AI generated picture. Data Visualization (The "Graph") 📊 When you ask me to "graph," "plot," or "chart" data (like a drag polar), I use a Code Interpreter. My Process: I write and execute Python code using a data visualization library (Matplotlib). This code performs calculations and generates a brand-new chart from scratch. Why It Fails to Display: The resulting image is a piece of procedurally generated content. The way it's embedded in the page is more complex than a standard image. Aggressive ad blockers or strict browser privacy settings often mistake this type of dynamic content for a pop-up, an ad, or a tracker, and they actively block it from appearing—which is what causes the "appears and then disappears" issue you described. Any help you can provide would be greatly appreciated. Thanks.
Hoton allon fuska da aka liƙa

You must log in to your account to reply to posts. Please start a new question, if you do not have an account yet.