

Firefox crashes
I am not able to copy adn paste the whole report as your system does not allow it. Here are the final lines:
/System/Library/PrivateFrameworks/DataDetectorsCore.framework/Versions/A/DataDetectorsCore
   0x7fff98166000 -     0x7fff98169ff7  com.apple.AppleSystemInfo (3.1.5 - 3.1.5) <6932B5EC-0EA9-333D-BF7E-665047392FEC> /System/Library/PrivateFrameworks/AppleSystemInfo.framework/Versions/A/AppleSystemInfo
   0x7fff9816a000 -     0x7fff98176fff  com.apple.speech.synthesis.framework (5.4.12 - 5.4.12) <71DA00B8-5EA2-326B-8814-59DB25512F65> /System/Library/Frameworks/ApplicationServices.framework/Versions/A/Frameworks/SpeechSynthesis.framework/Versions/A/SpeechSynthesis
   0x7fff98177000 -     0x7fff981afff7  com.apple.RemoteViewServices (2.0 - 101) <B2881449-8CFE-3D1C-B4BF-155640392533> /System/Library/PrivateFrameworks/RemoteViewServices.framework/Versions/A/RemoteViewServices
   0x7fff981b0000 -     0x7fff981dfffb  libsystem_m.dylib (3105) <08E1A4B2-6448-3DFE-A58C-ACC7335BE7E4> /usr/lib/system/libsystem_m.dylib
External Modification Summary:
 Calls made by other processes targeting this process:
   task_for_pid: 16
   thread_create: 0
   thread_set_state: 0
 Calls made by this process:
   task_for_pid: 0
   thread_create: 0
   thread_set_state: 0
 Calls made by all processes on this machine:
   task_for_pid: 4297
   thread_create: 0
   thread_set_state: 0
VM Region Summary: ReadOnly portion of Libraries: Total=376.0M resident=0K(0%) swapped_out_or_unallocated=376.0M(100%) Writable regions: Total=849.2M written=0K(0%) resident=0K(0%) swapped_out=0K(0%) unallocated=849.2M(100%)
VIRTUAL REGION
REGION TYPE SIZE COUNT (non-coalesced)
===== ======= =
Accelerate.framework 256K 3 Activity Tracing 2048K 2 CG backing stores 4828K 9 CG image 412K 32 CG shared images 496K 15 CoreAnimation 200K 36 CoreUI image data 2468K 29 CoreUI image file 192K 4 Dispatch continuations 4096K 2 Foundation 4K 2 IOKit 7940K 2 Image IO 12K 2 Kernel Alloc Once 8K 3 MALLOC 45.3M 23 MALLOC guard page 32K 7 MALLOC_LARGE (reserved) 2048K 3 reserved VM address space (unallocated) Memory Tag 242 12K 2 Memory Tag 249 408K 4 Memory Tag 251 12K 2 OpenCL 8K 2 OpenGL GLSL 256K 4 Process Corpse Info 2048K 2 STACK GUARD 56.2M 66 Stack 51.2M 66 VM_ALLOCATE 1.7G 848 VM_ALLOCATE (reserved) 15.1M 9 reserved VM address space (unallocated) __DATA 52.8M 309 __GLSLBUILTINS 2588K 2 __IMAGE 528K 2 __LINKEDIT 94.8M 27 __TEXT 281.2M 309 __UNICODE 552K 2 mapped file 1.8G 192 shared memory 21.4M 13
===== ======= =
TOTAL 4.1G 2001 TOTAL, minus reserved VM space 4.1G 2001
Model: MacBookPro7,1, BootROM MBP71.0039.B0E, 2 processors, Intel Core 2 Duo, 2.4 GHz, 8 GB, SMC 1.62f7 Graphics: NVIDIA GeForce 320M, NVIDIA GeForce 320M, PCI, 256 MB Memory Module: BANK 0/DIMM0, 4 GB, DDR3, 1067 MHz, 0x859B, 0x435435313236344243313036372E4D313646 Memory Module: BANK 1/DIMM0, 4 GB, DDR3, 1067 MHz, 0x859B, 0x435435313236344243313036372E4D313646 AirPort: spairport_wireless_card_type_airport_extreme (0x14E4, 0x8D), Broadcom BCM43xx 1.0 (5.106.98.100.24) Bluetooth: Version 4.4.6f1 17910, 3 services, 27 devices, 1 incoming serial ports Network Service: Ethernet, Ethernet, en0 Serial ATA Device: ST1000LM024 HN-M101MBB, 1 TB Serial ATA Device: MATSHITADVD-R UJ-898 USB Device: USB 2.0 Bus USB Device: Built-in iSight USB Device: iPhone USB Device: USB 2.0 Bus USB Device: Card Reader USB Device: USB Bus USB Device: USB Bus USB Device: BRCM2046 Hub USB Device: Bluetooth USB Host Controller USB Device: IR Receiver USB Device: Apple Optical USB Mouse USB Device: Apple Internal Keyboard / Trackpad FireWire Device: Vendor 0x1F2 Device 0x101800, 0x1F2, Up to 400 Mb/sec Thunderbolt Bus:
All Replies (2)
We're sorry to hear that Firefox is crashing. In order to assist you better, please follow the steps below to provide us crash IDs to help us learn more about your crash.
The crash report is several pages of data. We need the report numbers to see the whole report.
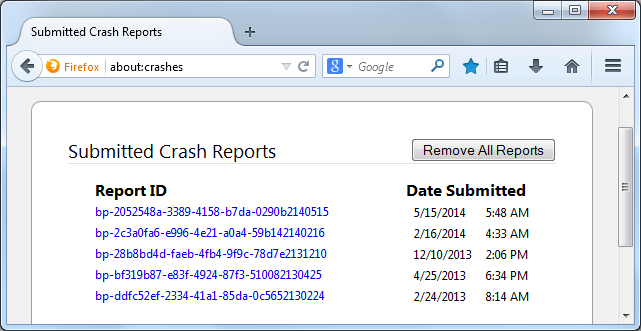
- Enter about:crashes in the Firefox address bar and press Enter. A Submitted Crash Reports list will appear, similar to the one shown below.
- Copy the 5 most recent Report IDs that start with bp- and then go back to your forum question and paste those IDs into the "Post a Reply" box.
Note: If a recent Report ID does not start with bp- click on it to submit the report.
(Please don't take a screenshot of your crashes, just copy and paste the IDs. The below image is just an example of what your Firefox screen should look like.)
Thank you for your help!
More information and further troubleshooting steps can be found in the Troubleshoot Firefox crashes (closing or quitting unexpectedly) article.
Firefox has crashed 10 times in the last couple of days and there are no crashes shown in that time in the place you asked me to check (about:crashes)