

firefox hangs when trying to display SVG content
when trying to load the content created by the url below, firefox uses a lot of memory and becomes unresponsive, so that I have to close (and kill) it.
The same happens if I save the content to a file with another browser (i.e. opera) and just try to open this file.
I've tried other machines. It works under windows but not under my SuSE and Ubuntu (precise) Linux. I've tried without plugins and with hardware acceleration disabled and with firefox being reset.
Smaller graphs like http://pollux.informatik.uni-bremen.de:8000/Basic/Numbers.casl are no problem.
Chosen solution
Ubuntu switched to firefox 16 which solves (part of) my problem
Read this answer in context 👍 0All Replies (10)
Just thought I would say works for me. ( It does not look like the sort of image that would be challenging, it is lines, curves and polygons filled with solid colour and text .)
I can near enough instantly load both http://pollux.informatik.uni-bremen.de:8000/Basic/Numbers.casl & http://pollux.informatik.uni-bremen.de:8000/Basic/RelationsAndOrders.casl?svg
I am using 64 bit Ubuntu 12.04 with canonical Aurora. (fx17.0a2) I do not notice any error console messages. I am not sure it would help you but try opening about:memory before opening the graphics page, it should show you what is happening with memory (but that may also lock up of course).
Maybe someone else has a better answer.
Right, it should be really no problem to display this SVG graph (it used to work in the past), but I still don't know why it fails on at least two different 32 bit machines under linux.
I do not see any memory problem, drilling down using about:memory verbose the graphics page you have a problem with uses less than 1/2 % of my Firefox memory at present.
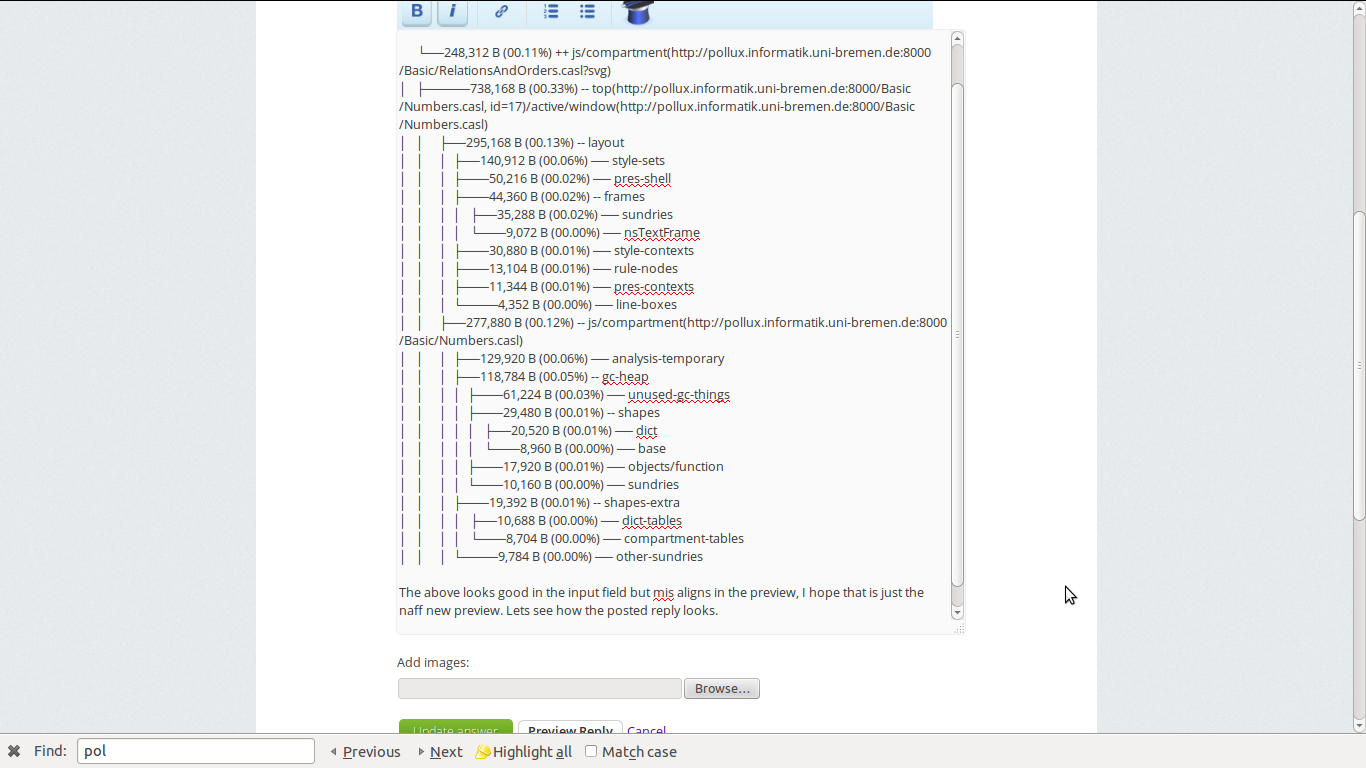
      └──248,312 B (00.11%) ++ js/compartment(http://pollux.informatik.uni-bremen.de:8000/Basic/RelationsAndOrders.casl?svg)
│   ├─────738,168 B (00.33%) -- top(http://pollux.informatik.uni-bremen.de:8000/Basic/Numbers.casl, id=17)/active/window(http://pollux.informatik.uni-bremen.de:8000/Basic/Numbers.casl)
│   │     ├──295,168 B (00.13%) -- layout
│   │     │  ├──140,912 B (00.06%) ── style-sets
│   │     │  ├───50,216 B (00.02%) ── pres-shell
│   │     │  ├───44,360 B (00.02%) -- frames
│   │     │  │   ├──35,288 B (00.02%) ── sundries
│   │     │  │   └───9,072 B (00.00%) ── nsTextFrame
│   │     │  ├───30,880 B (00.01%) ── style-contexts
│   │     │  ├───13,104 B (00.01%) ── rule-nodes
│   │     │  ├───11,344 B (00.01%) ── pres-contexts
│   │     │  └────4,352 B (00.00%) ── line-boxes
│   │     ├──277,880 B (00.12%) -- js/compartment(http://pollux.informatik.uni-bremen.de:8000/Basic/Numbers.casl)
│   │     │  ├──129,920 B (00.06%) ── analysis-temporary
│   │     │  ├──118,784 B (00.05%) -- gc-heap
│   │     │  │  ├───61,224 B (00.03%) ── unused-gc-things
│   │     │  │  ├───29,480 B (00.01%) -- shapes
│   │     │  │  │   ├──20,520 B (00.01%) ── dict
│   │     │  │  │   └───8,960 B (00.00%) ── base
│   │     │  │  ├───17,920 B (00.01%) ── objects/function
│   │     │  │  └───10,160 B (00.00%) ── sundries
│   │     │  ├───19,392 B (00.01%) -- shapes-extra
│   │     │  │   ├──10,688 B (00.00%) ── dict-tables
│   │     │  │   └───8,704 B (00.00%) ── compartment-tables
│   │     │  └────9,784 B (00.00%) ── other-sundries
The above looks good in the input field but mis aligns in the preview, I hope that is just the naff new preview. Lets see how the posted reply looks.
Can you figure out where the memory is being used when you have a problem ?
I have now added a screenshot of the preview
Modified by cor-el
attempt to tidy up, indent each line to force preformatted view
 └──248,312 B (00.11%) ++ js/compartment(http://pollux.informatik.uni-bremen.de:8000/Basic/RelationsAndOrders.casl?svg)
│   ├─────738,168 B (00.33%) -- top(http://pollux.informatik.uni-bremen.de:8000/Basic/Numbers.casl, id=17)/active/window(http://pollux.informatik.uni-bremen.de:8000/Basic/Numbers.casl)
│   │     ├──295,168 B (00.13%) -- layout
│   │     │  ├──140,912 B (00.06%) ── style-sets
│   │     │  ├───50,216 B (00.02%) ── pres-shell
│   │     │  ├───44,360 B (00.02%) -- frames
│   │     │  │   ├──35,288 B (00.02%) ── sundries
│   │     │  │   └───9,072 B (00.00%) ── nsTextFrame
│   │     │  ├───30,880 B (00.01%) ── style-contexts
│   │     │  ├───13,104 B (00.01%) ── rule-nodes
│   │     │  ├───11,344 B (00.01%) ── pres-contexts
│   │     │  └────4,352 B (00.00%) ── line-boxes
│   │     ├──277,880 B (00.12%) -- js/compartment(http://pollux.informatik.uni-bremen.de:8000/Basic/Numbers.casl)
│   │     │  ├──129,920 B (00.06%) ── analysis-temporary
│   │     │  ├──118,784 B (00.05%) -- gc-heap
│   │     │  │  ├───61,224 B (00.03%) ── unused-gc-things
│   │     │  │  ├───29,480 B (00.01%) -- shapes
│   │     │  │  │   ├──20,520 B (00.01%) ── dict
│   │     │  │  │   └───8,960 B (00.00%) ── base
│   │     │  │  ├───17,920 B (00.01%) ── objects/function
│   │     │  │  └───10,160 B (00.00%) ── sundries
│   │     │  ├───19,392 B (00.01%) -- shapes-extra
│   │     │  │   ├──10,688 B (00.00%) ── dict-tables
│   │     │  │   └───8,704 B (00.00%) ── compartment-tables
│   │     │  └────9,784 B (00.00%) ── other-sundries
│   │     └──165,120 B (00.07%) -- dom
│   │        ├──106,336 B (00.05%) ── element-nodes
│   │        ├───49,152 B (00.02%) ── text-nodes
│   │        ├────9,472 B (00.00%) ── other [2]
│   │        └──────160 B (00.00%) ── comment-nodes
I cannot look anymore at about:memory for RelationsAndOrders.casl, but for Numbers.casl I just have:
822,788 B (01.20%) -- top(http://pollux.informatik.uni-bremen.de:8000/Basic/Numbers.casl?, id=38) ──536,724 B (00.78%) -- cached ... 286,064 B (00.42%) -- active/window(http://pollux.informatik.uni-bremen.de:8000/Basic/Numbers.casl?) ... I do not see "js/compartment".
I am at a loss to explain why such a page would stop firefox, due to memory problems.
You have already tried safe-mode and with hardware acceleration off. Presumably you also tried clearing the cache.
If you could get about:memory to run after attempting to load the page at least it would demonstrate where the high memory use was. You could try creating and using a clean profile, ensuring it had no add-ons, no theme other than default, and no plugins, that should rule out anything else interfering.
- http://kb.mozillazine.org/Profile_Manager#Creating_a_new_profile
- Take care with a new profile, to avoid problems
- use only an empty folder for any new profile
- do not rename or delete profiles (remove launchers/links instead) until you are absolutely certain what you are doing
Maybe more severe than memory is a 100% CPU usage (displayed by top) all the time (or 98% on a single core virtual machine).
 PID USER      PR  NI  VIRT  RES  SHR S %CPU %MEM    TIME+  COMMAND
3040 maeder    20   0  485m 138m  50m R  100  1.7   3:48.46 firefox
It doesn't work for me either with Firefox 15.0.1 under Linux.
It does work with Firefox 14 and Firefox 16 beta and later, but not with Firefox 15.0.1.
It freezes completely with that version and the only thing left is to kill that process.
Hi cor-el,
no doubt you will sort it out . If it helps at all please note it runs ok on Mozilla Fx15.0.1 under 64 bit Ubuntu.
John
Chosen Solution
Ubuntu switched to firefox 16 which solves (part of) my problem