

My startup's webgl app lags in FireFox, unless I profile with screenshots on
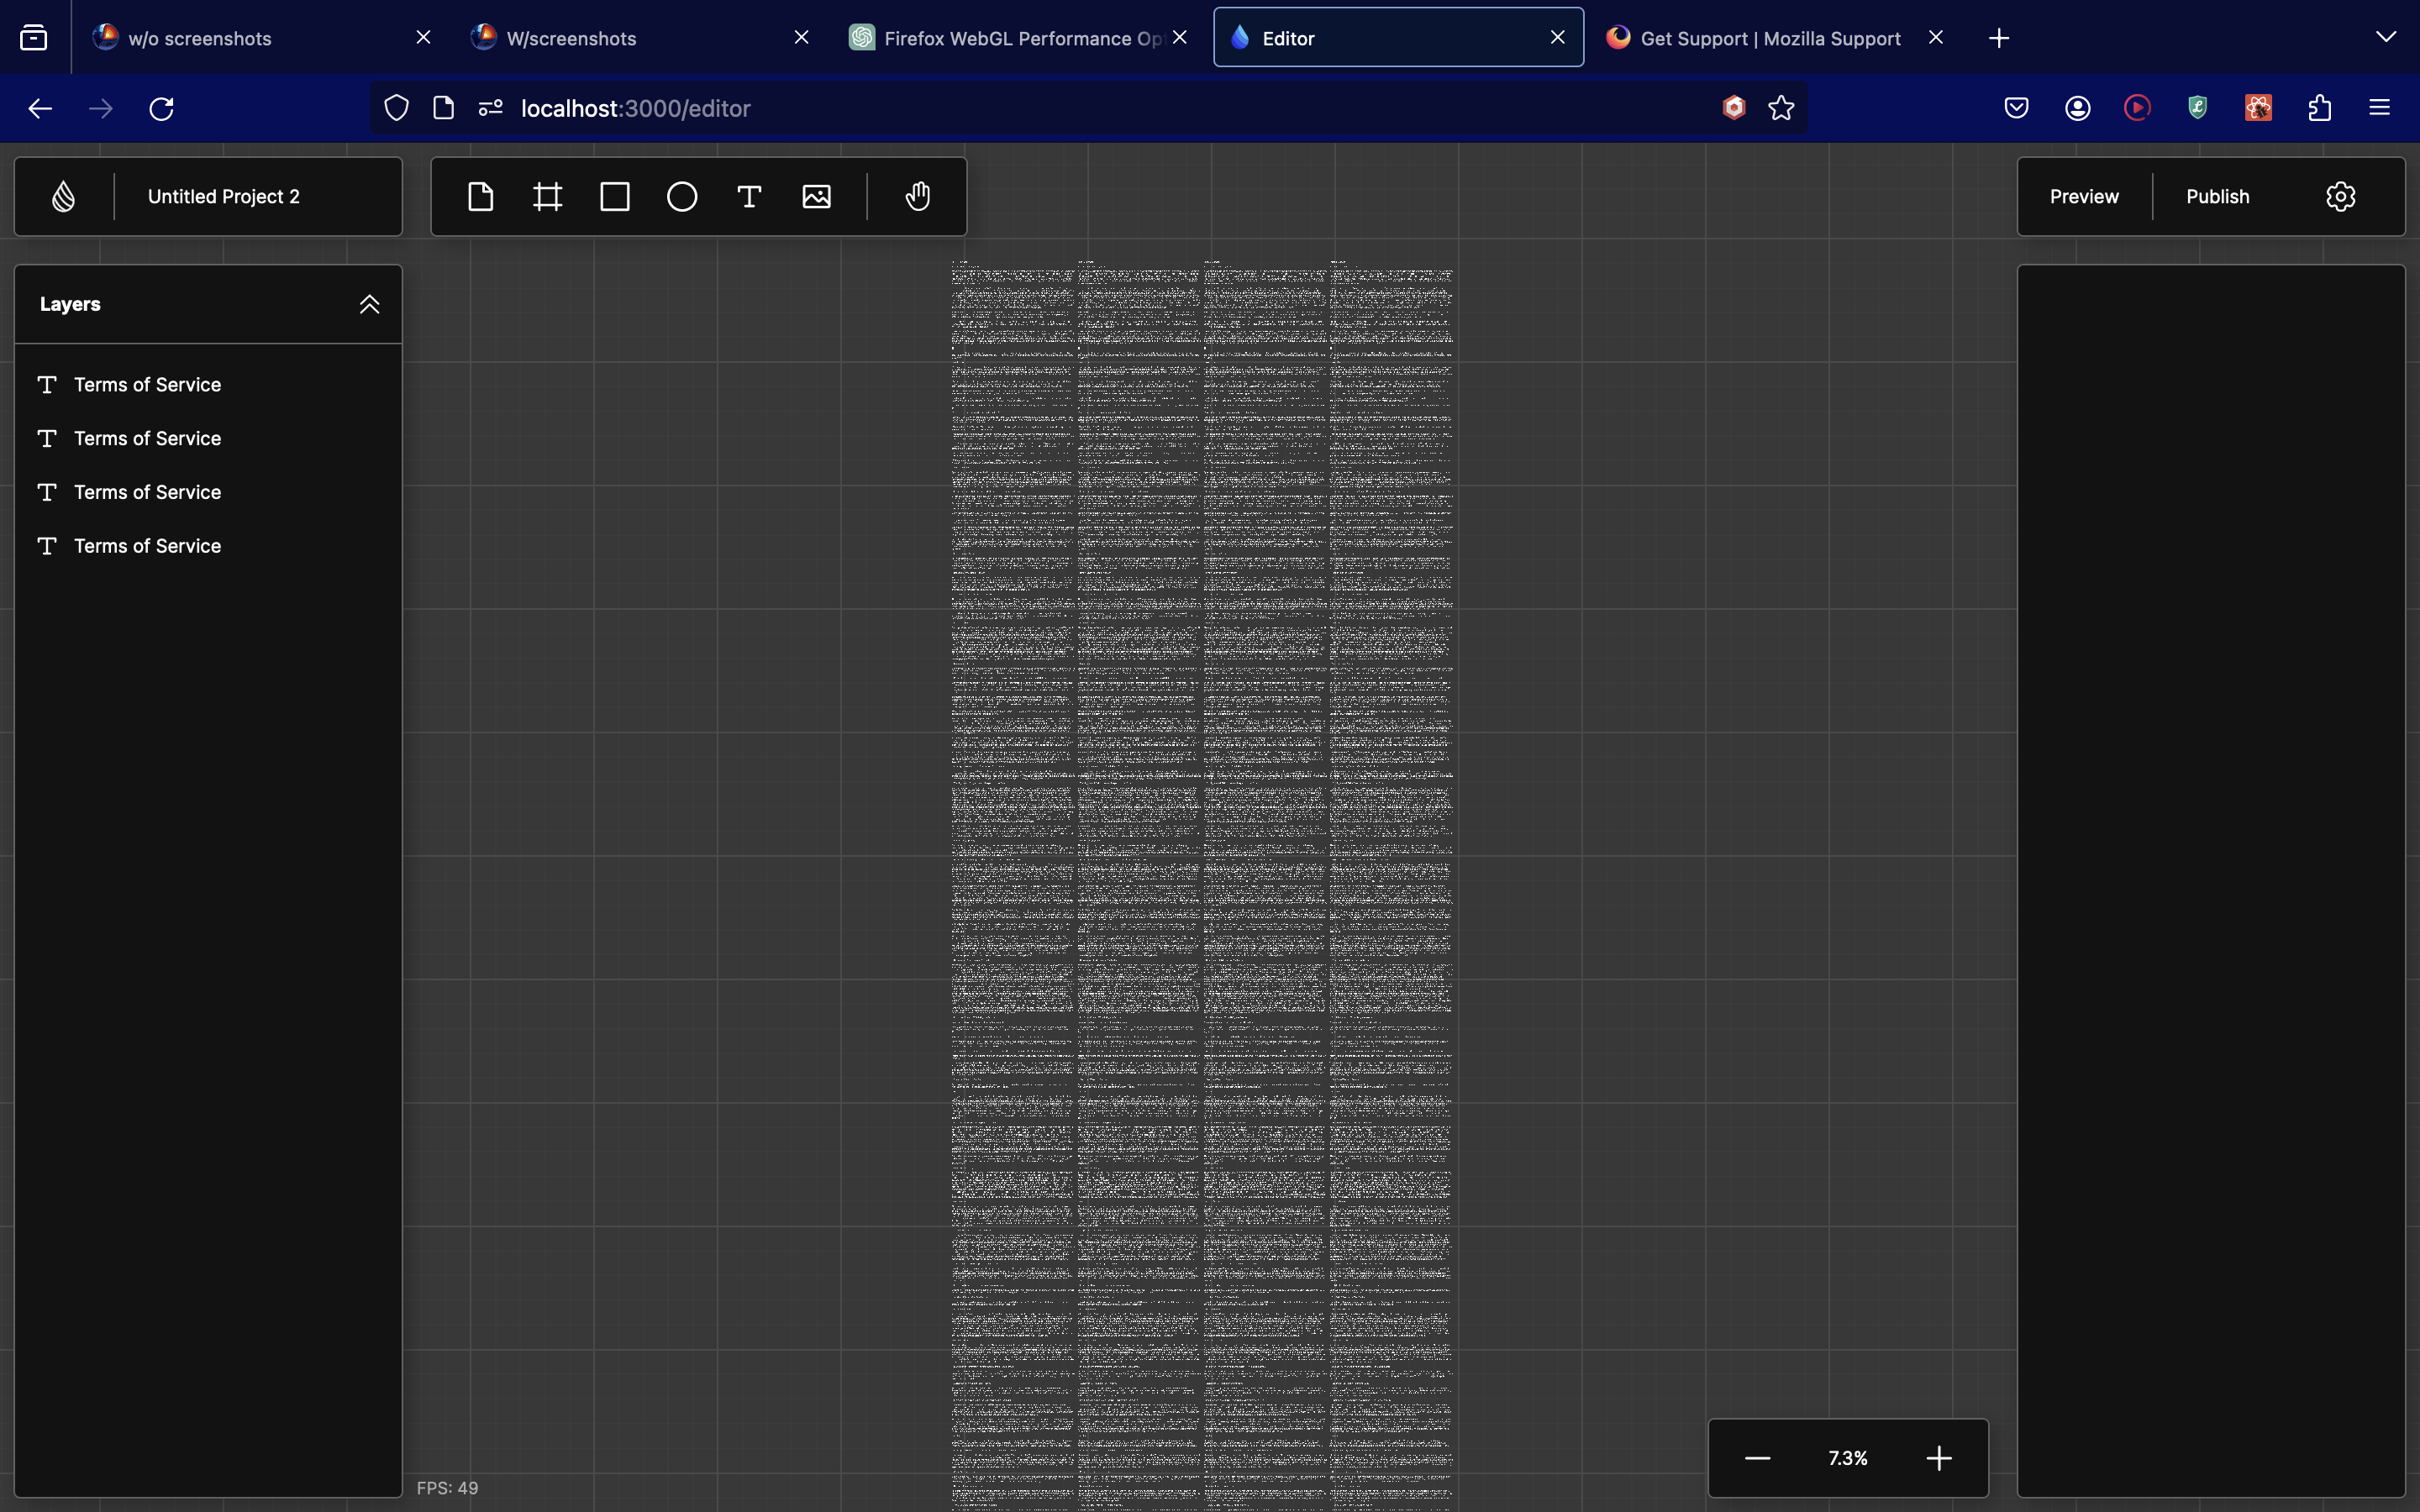
I am a startup founder. I'm making a webgl rendering engine. I'm doing a stress test with 4 large paragraphs amounting to tens of millions of triangles on a macbook air. Firefox is on the latest version.
When I run the app in chrome/safari/opera, the performance is normal. ~45fps. But in Firefox, it's very slow. My FPS counter (in a requestAnimationFrame loop) says ~45fps on all browsers. But in Firefox, even though the counter says that, the real frame rate is ~3-5fps.
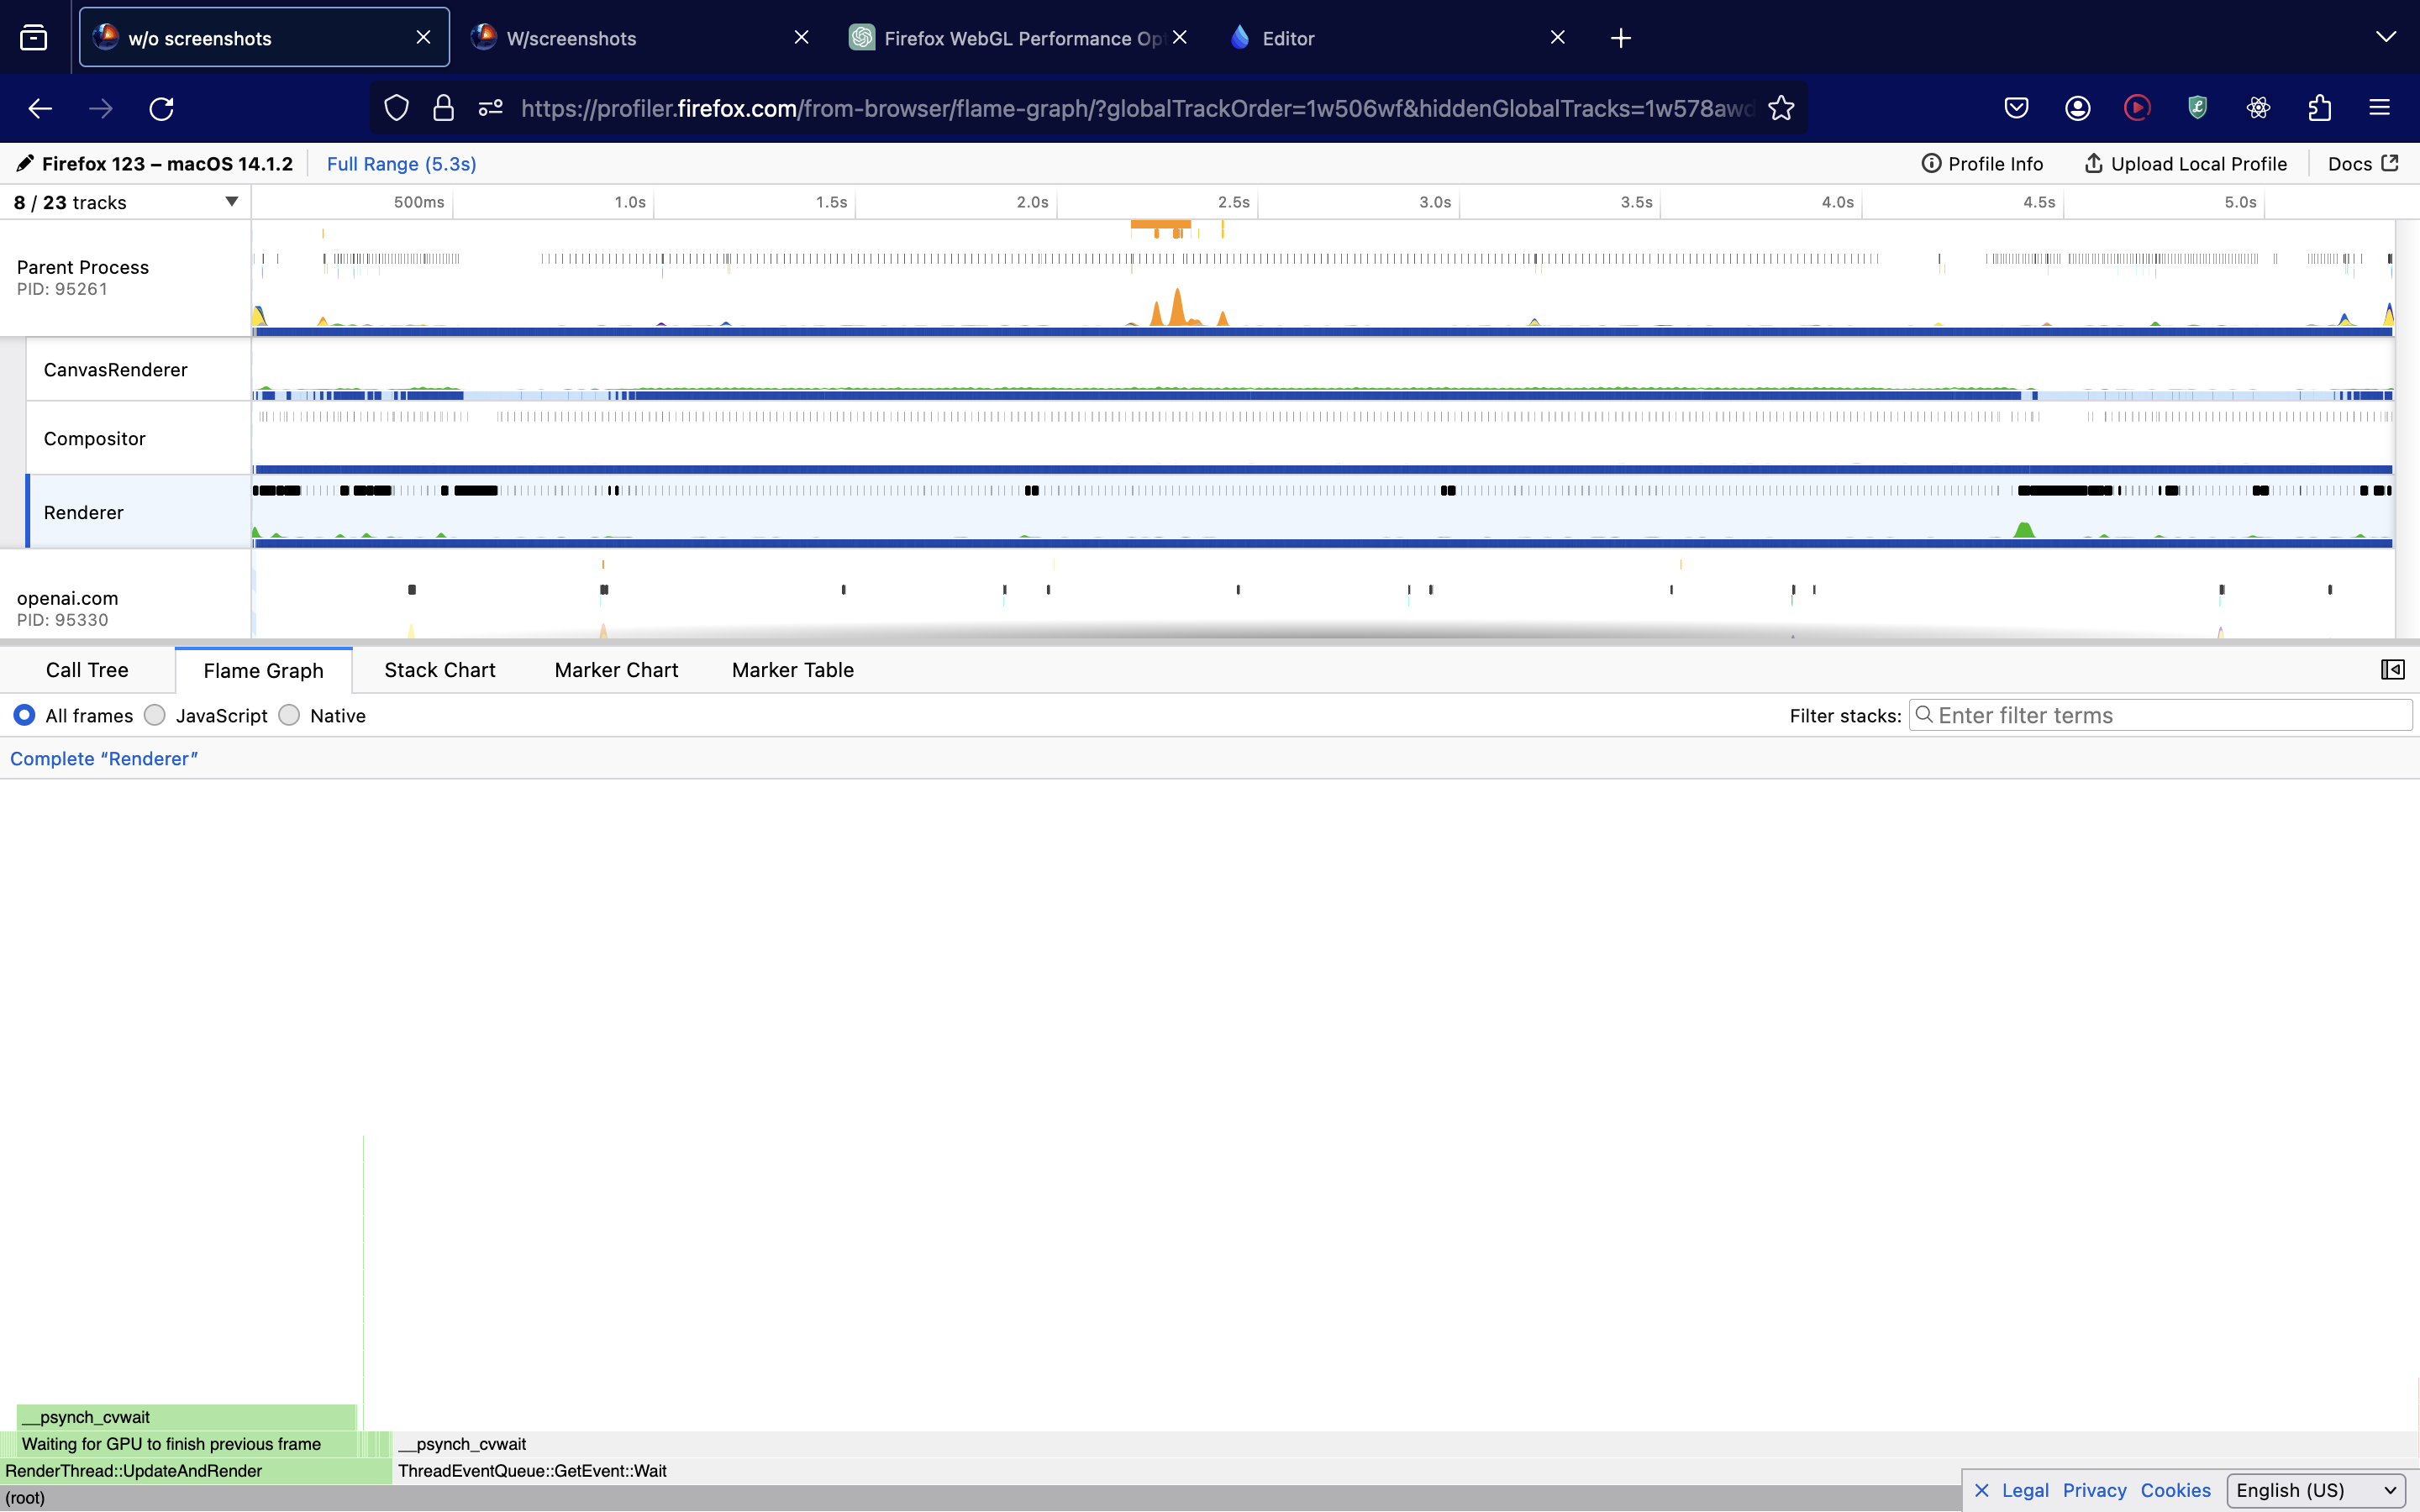
When I try to profile, the problem magically goes away and we're back to ~45fps. I played around with profiler settings, and the key determinant is whether or not I'm taking screenshots. No screenshots = slow. Screenshots = fast.
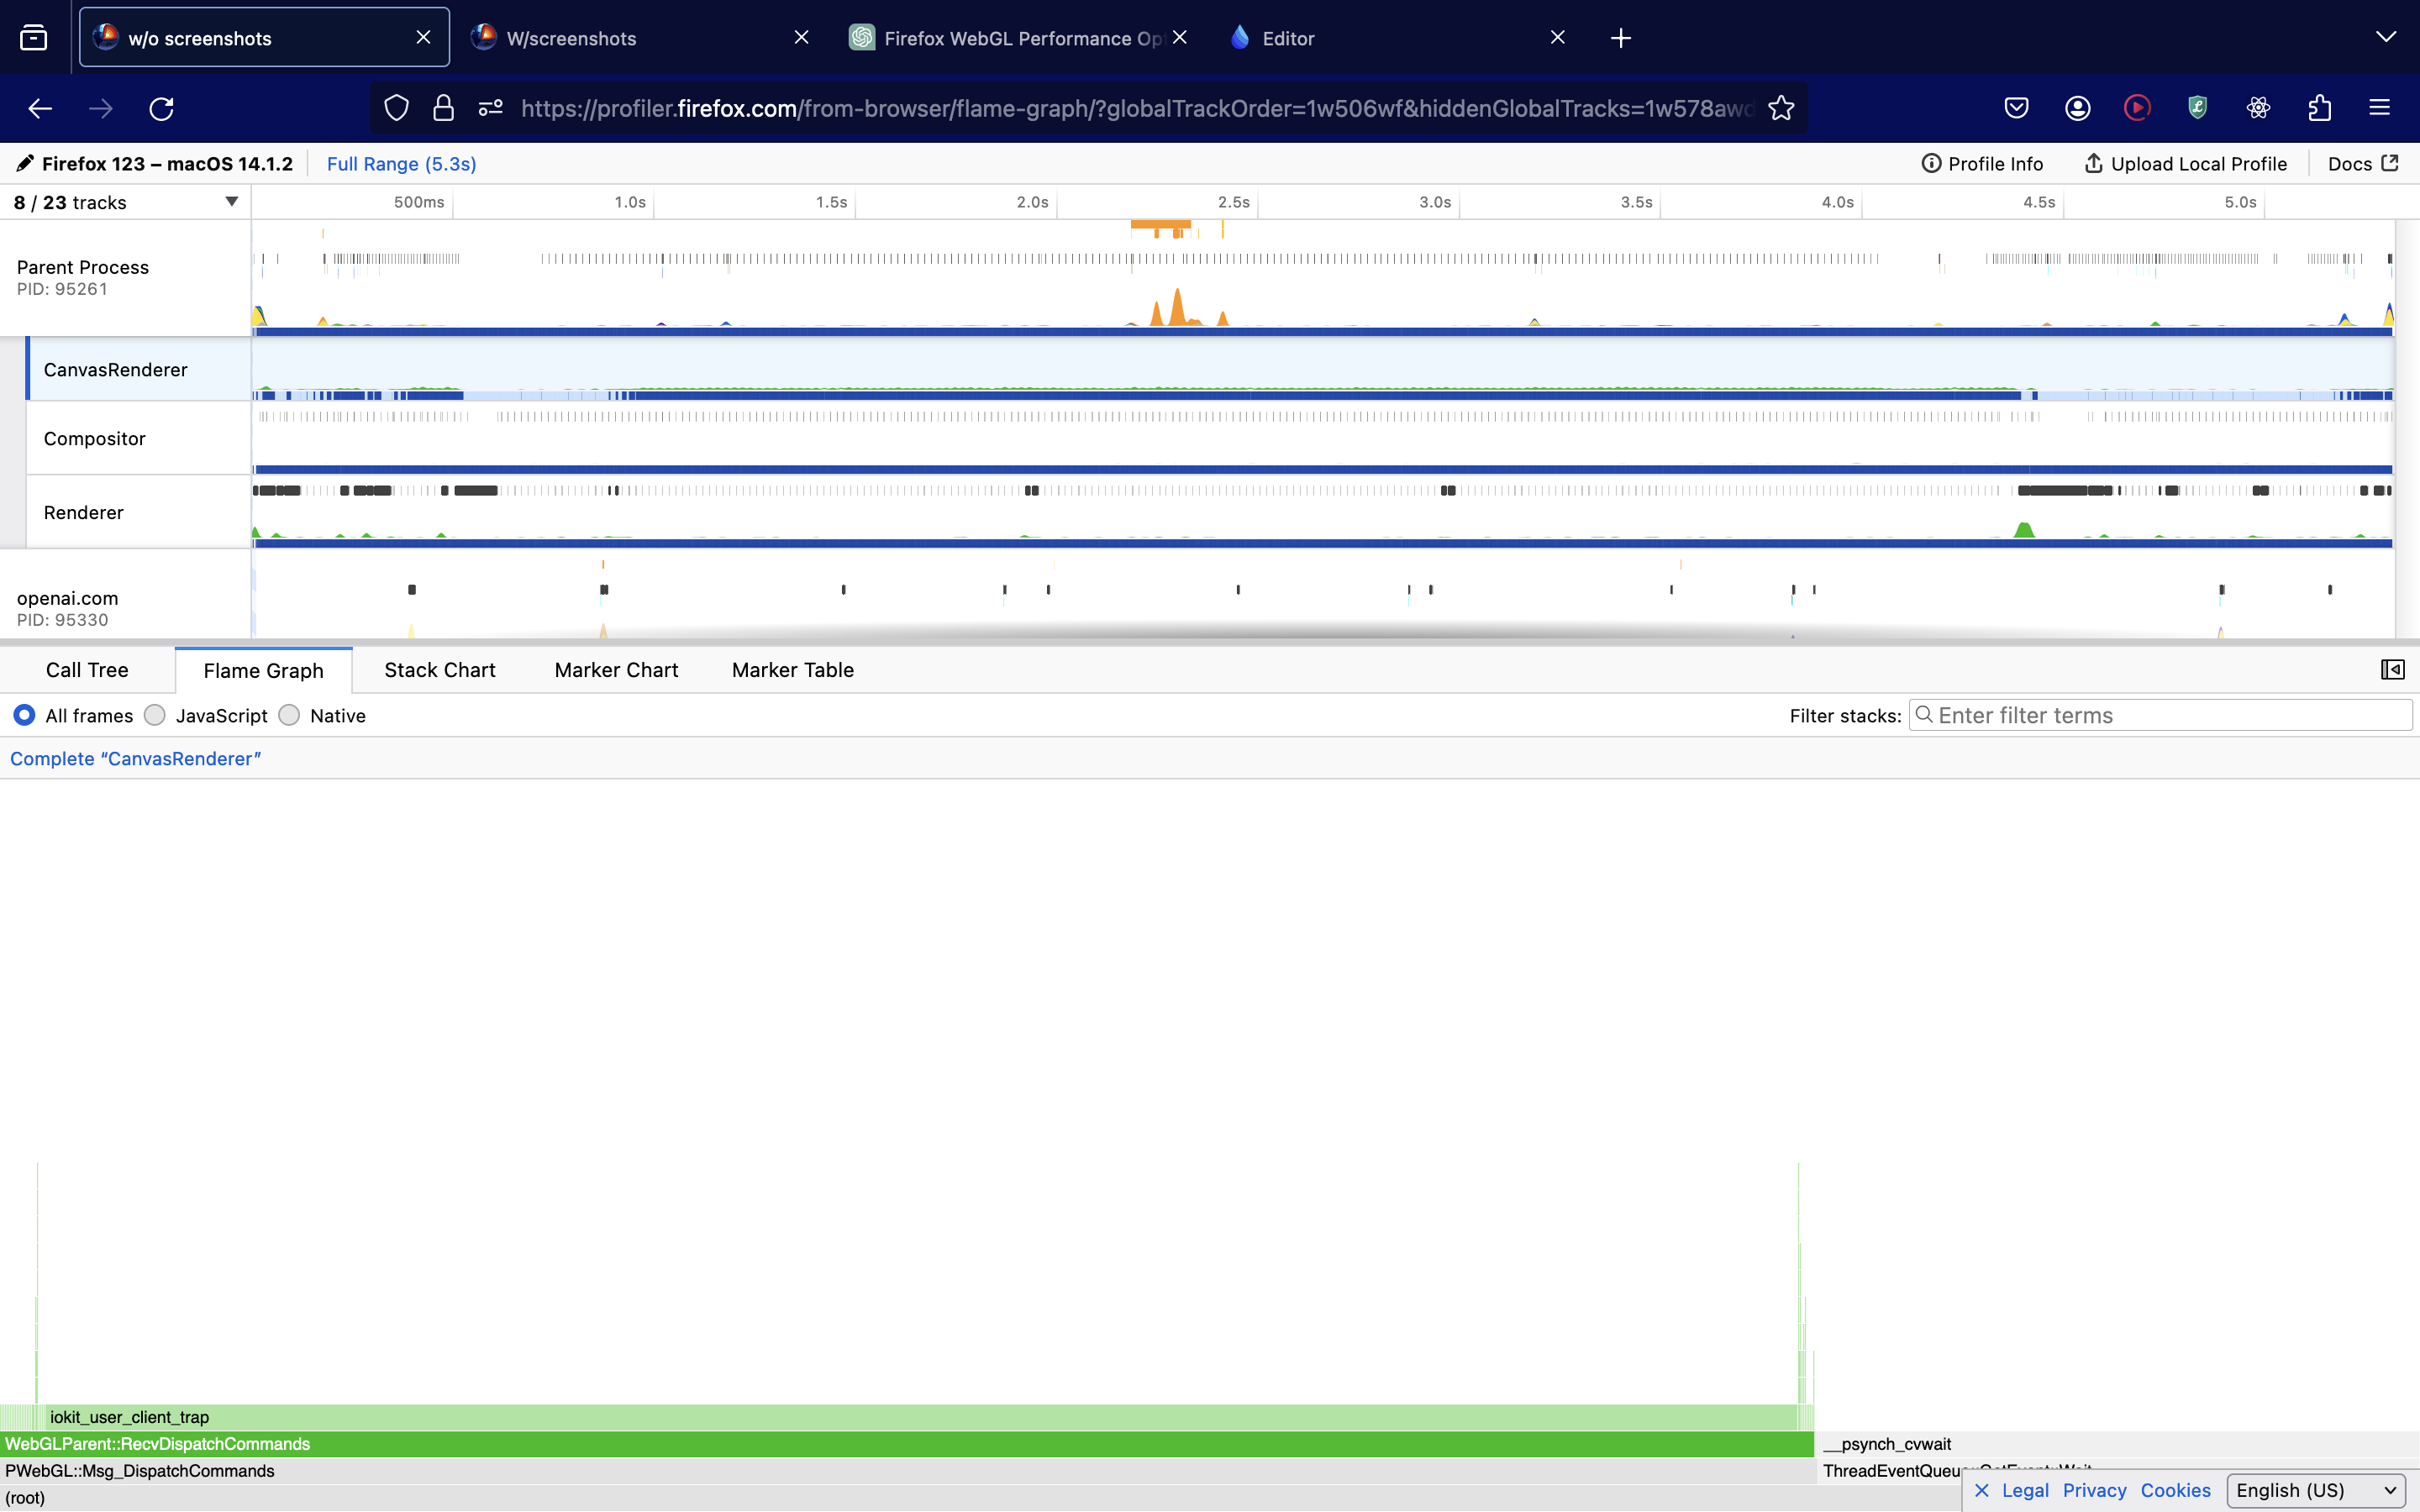
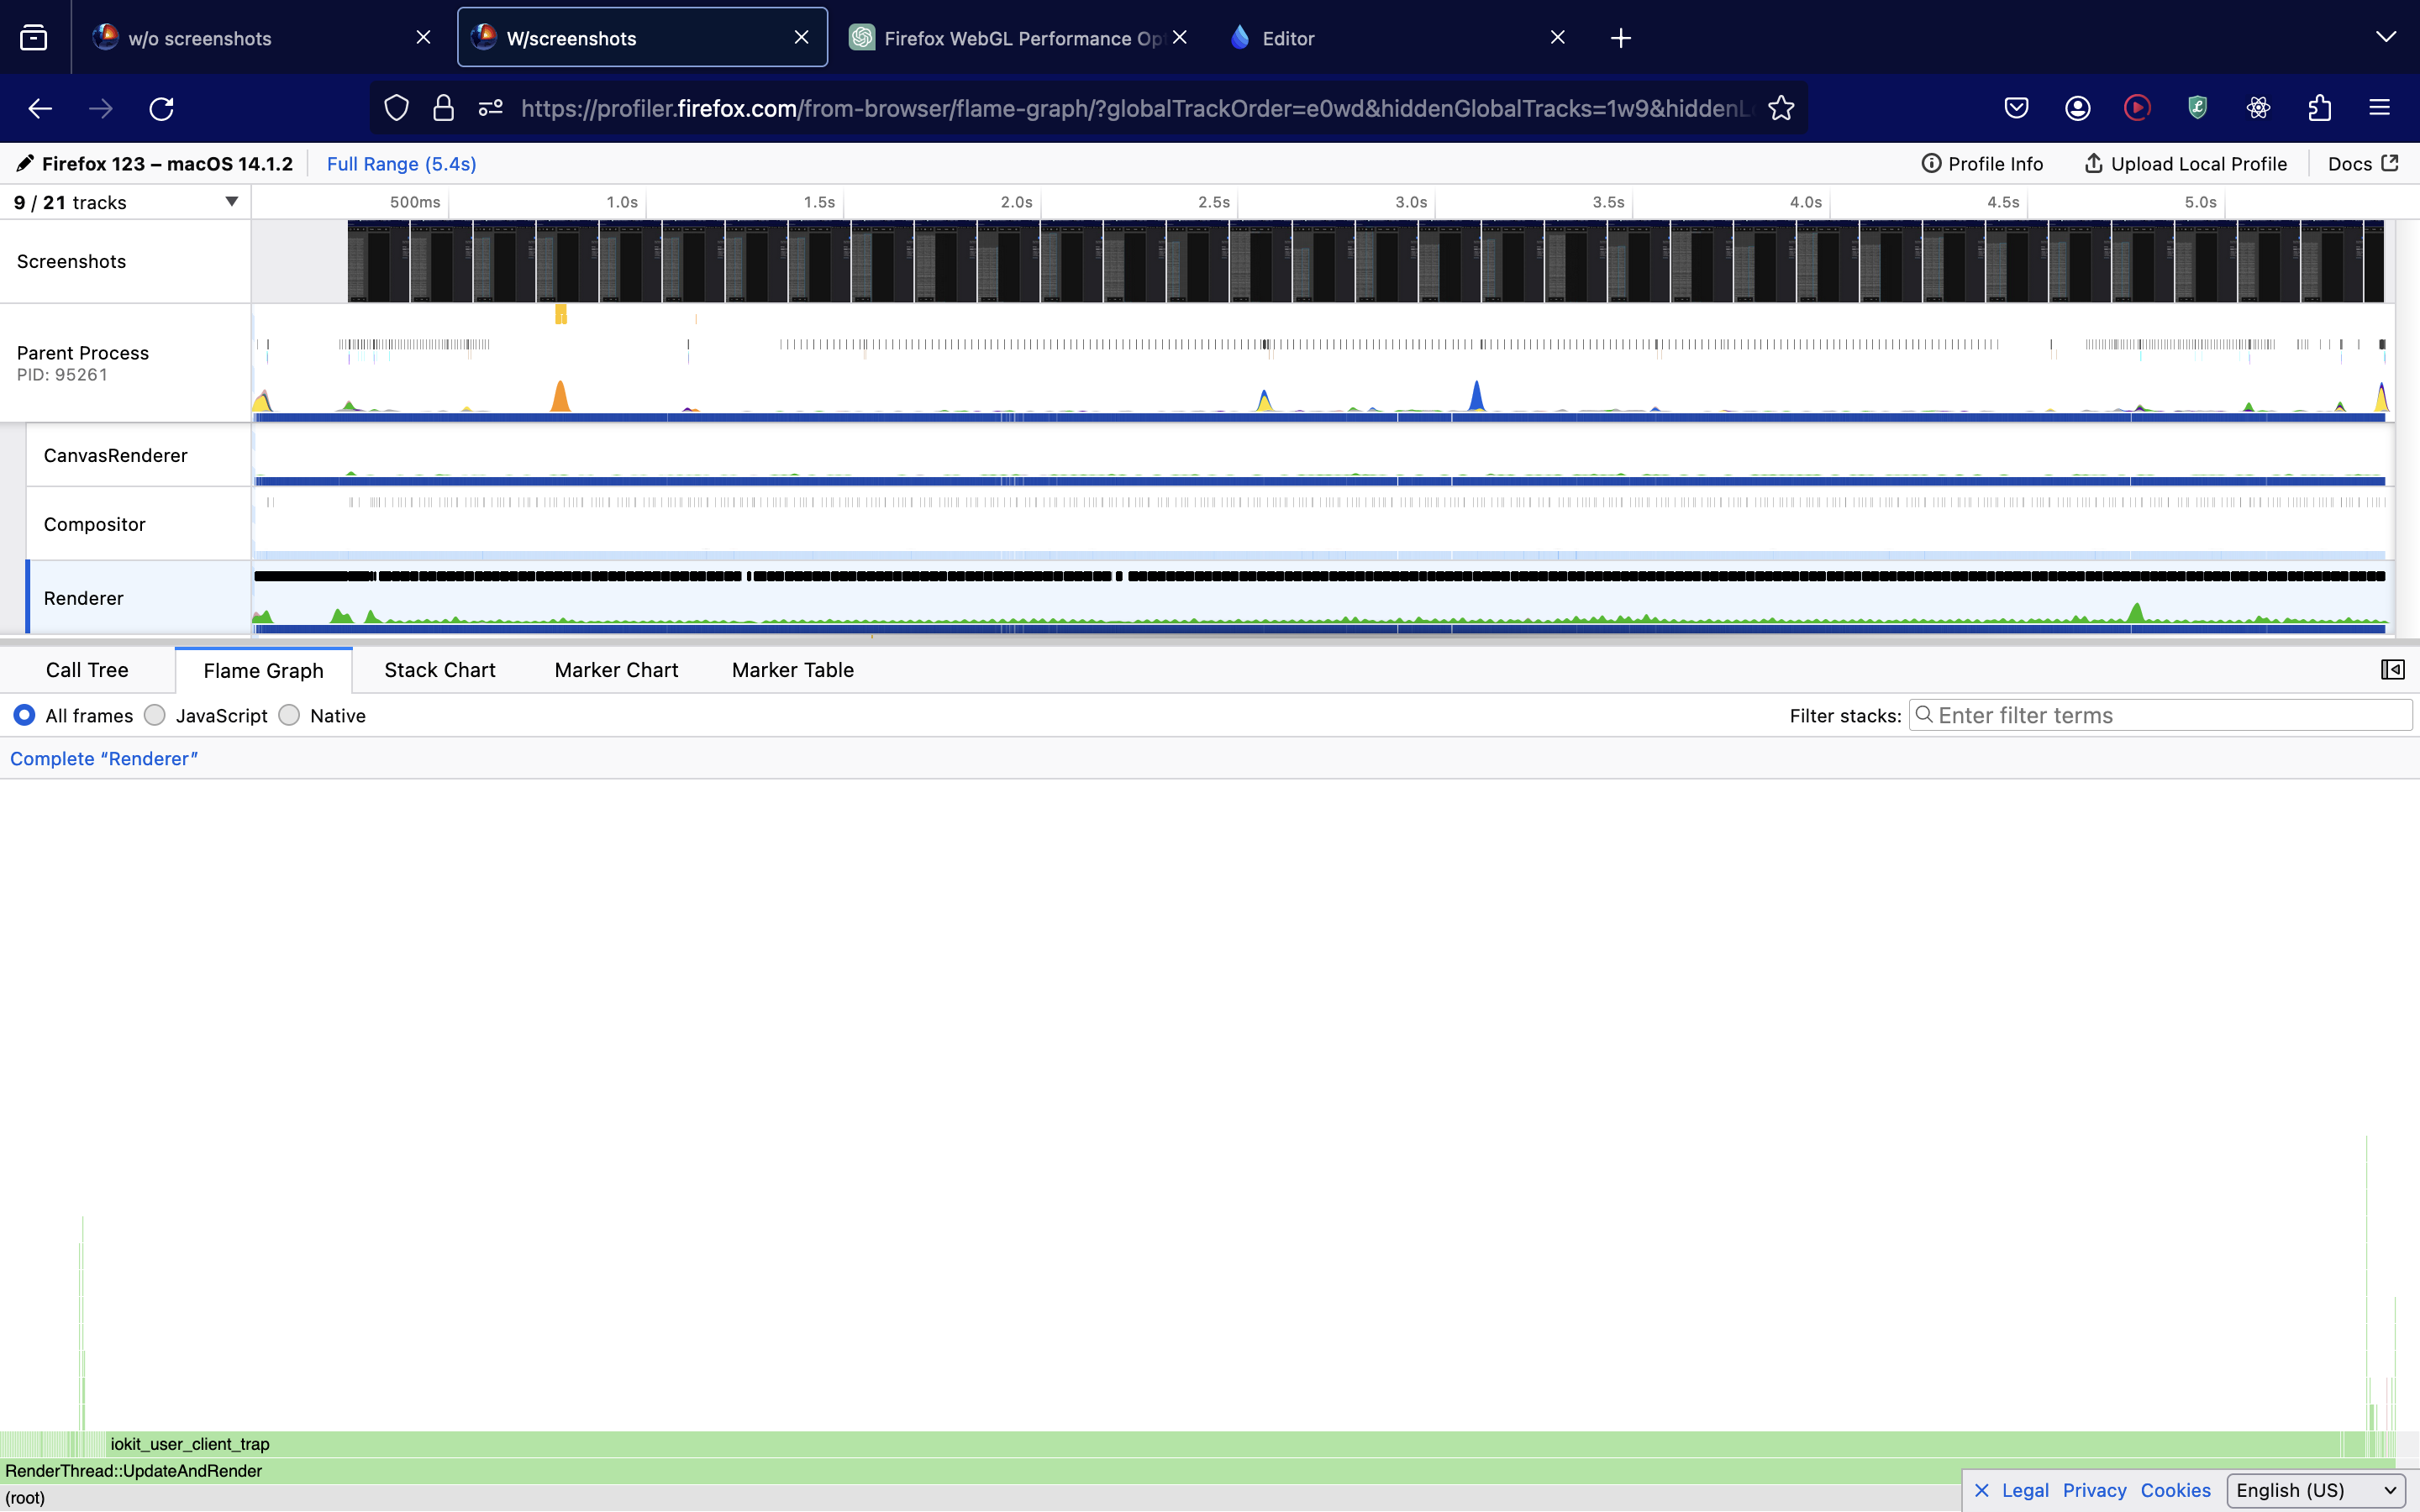
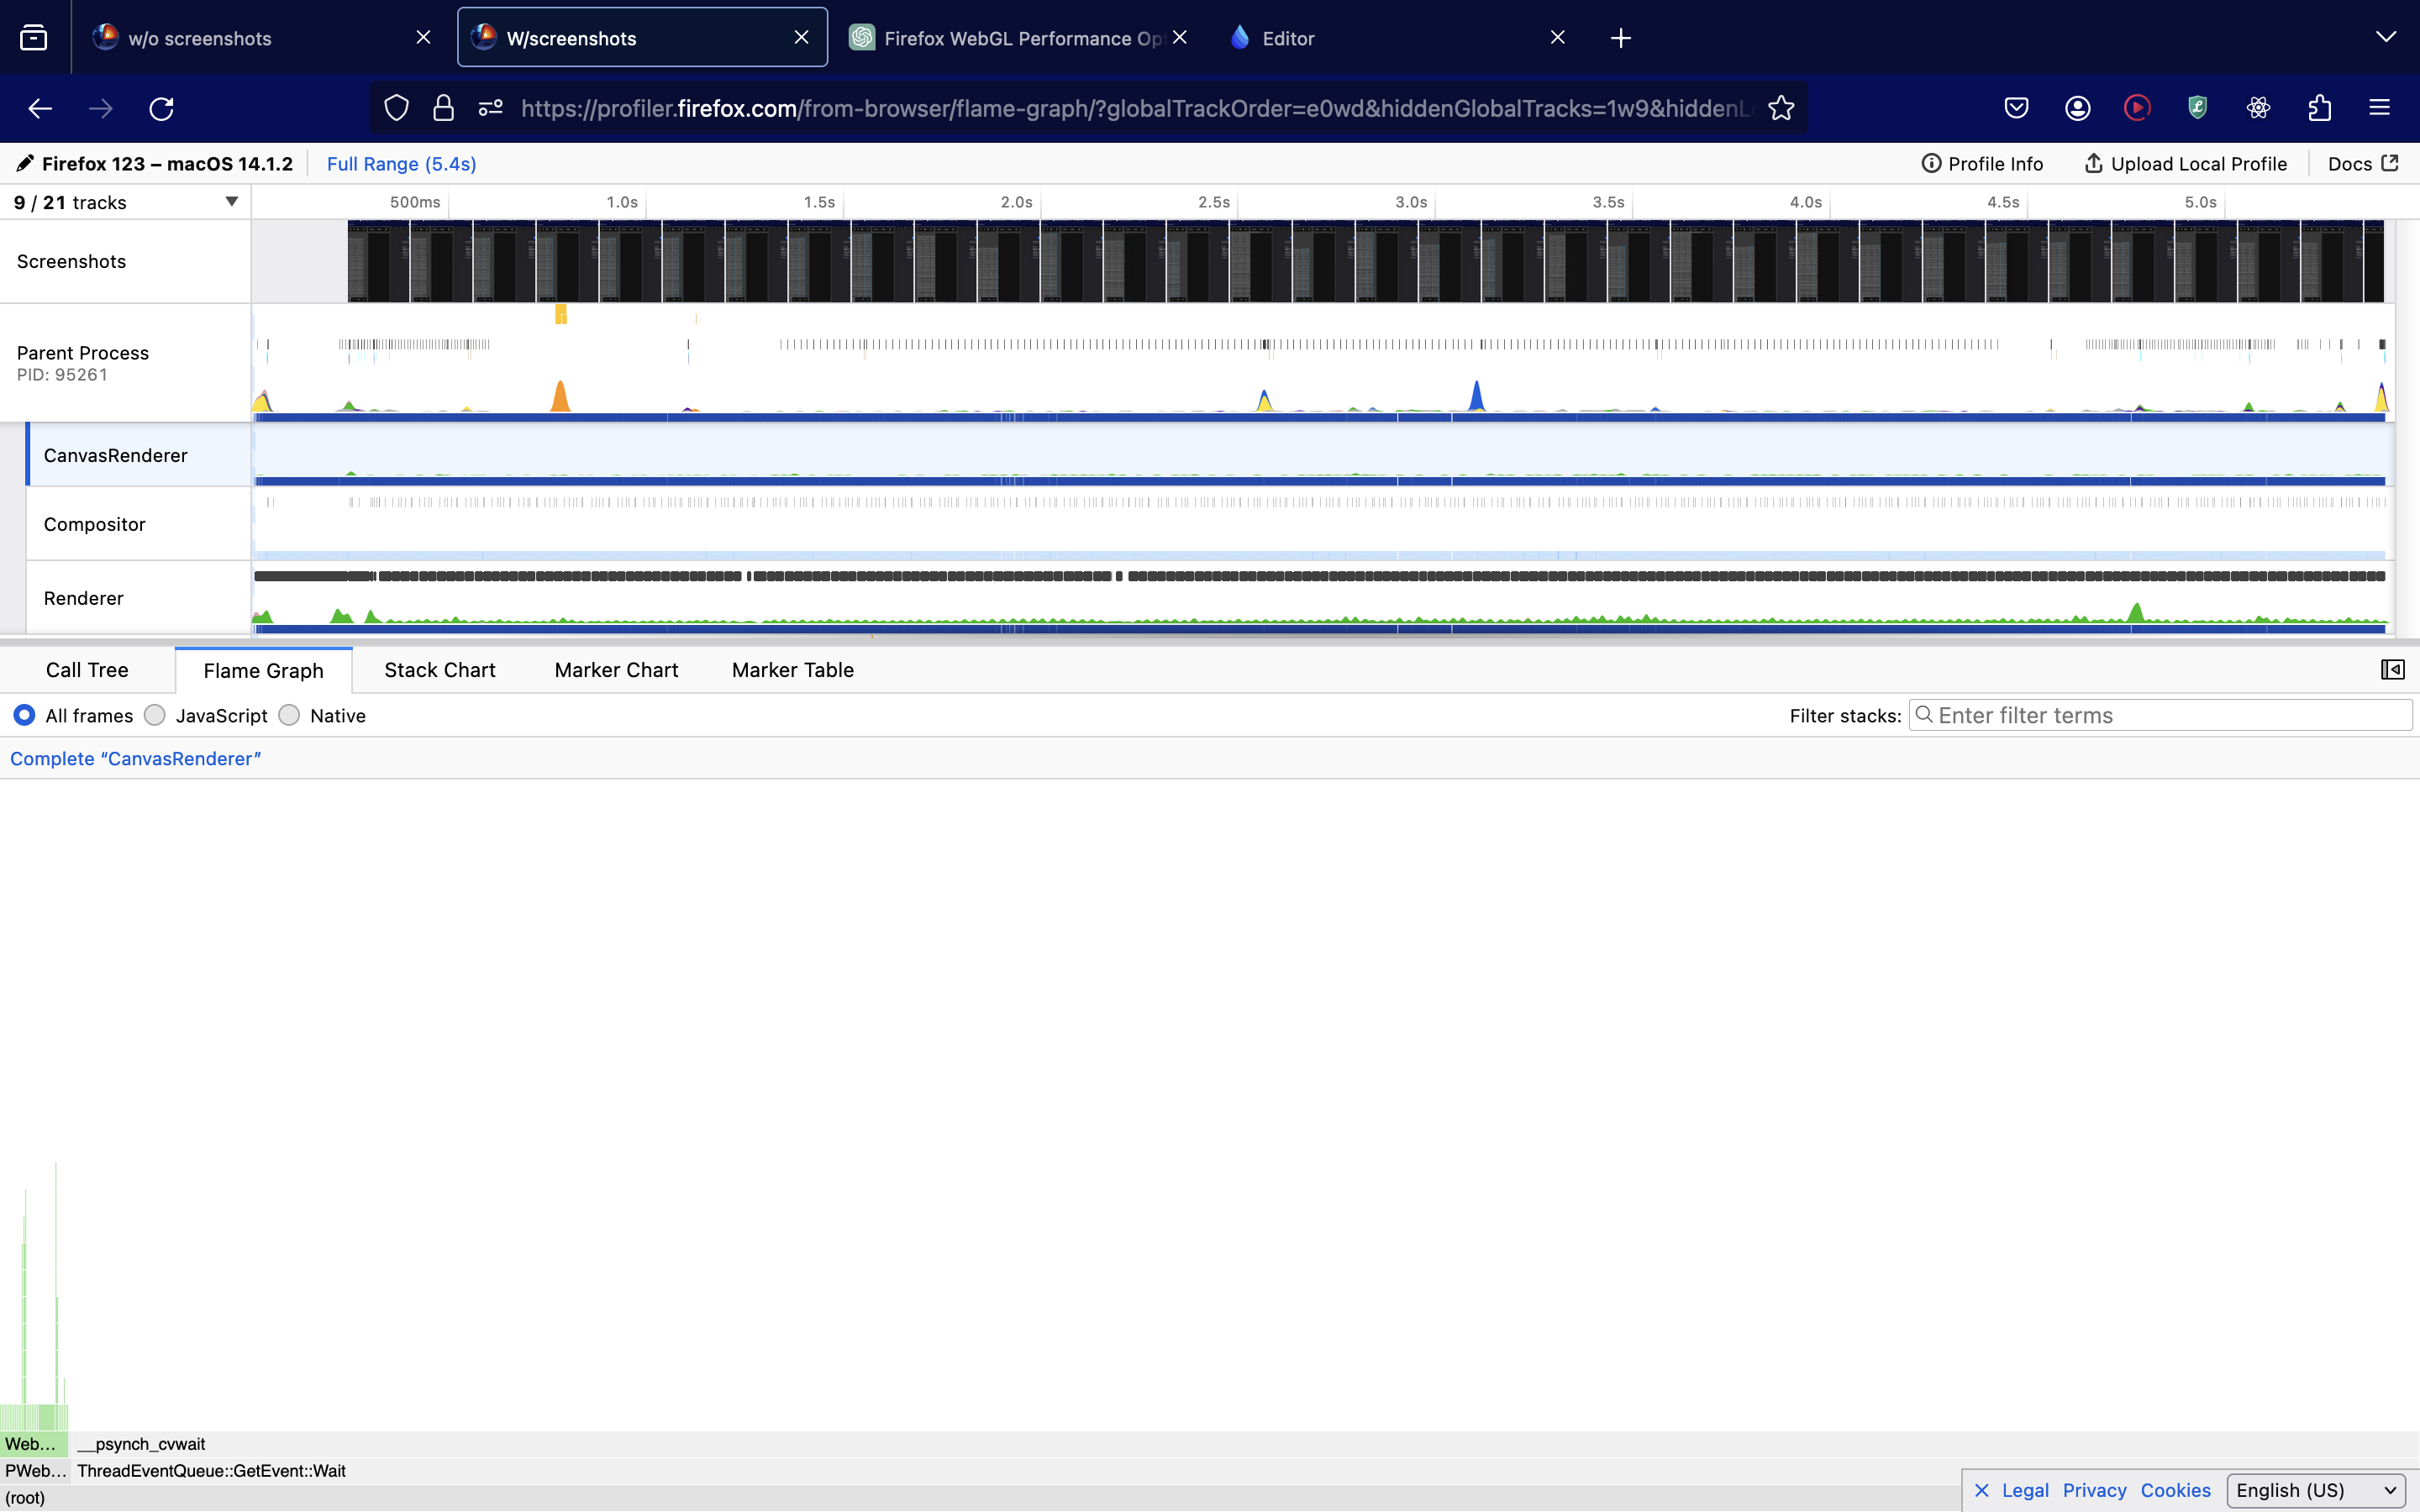
In the flame graph, in slow mode (no screenshots), it seems like I get stuck in the canvasRenderer and the Renderer mostly waits for it. But in fast mode (with screenshots), the canvasRenderer keeps up and the Renderer spents most it's time in: iokit_user_client_trap
I'm not sure what to do. This is only a problem on Firefox. There's some sort of gpu/threads/something that switches when I profile with screenshots that makes it way faster. This performance hit basically ruins my app for Firefox only. Any idea what I should do?
All Replies (1)
I guess the best option is to file a bug on https://bugzilla.mozilla.org. Perhaps devs could use your stress test to improve our webgl implementation.