

No Complete Page Loading with Web Developer Tools Switched On
Hello,
Since a while I noticed on several website that the content is not fully loading if you have the Web Developer Tools switched on.
For example: http://www.clicksud.org/2018/02/templierii-sezonul-1-episodul-10-online.html
> go to page, page loads, you have a few video players displayed > open Web Developer tools, reload page, it loads a few bits followed by "infinite" stuck loading and you cannot click anything on the page
On other pages I noticed "Debugger is paused. Some features like mouse selection will not work." in the Inspector tab.
What is causing all these stuff and how can I stop it? I simply want the pages to load... It happens across different devices.
Thank you.
Alle Antworten (2)
That sounds quite obvious. Since you mention that the debugger gets active it sounds that you have set the debugger to stop on errors (exceptions). So you need to check the Debugger tab in the Web Console.
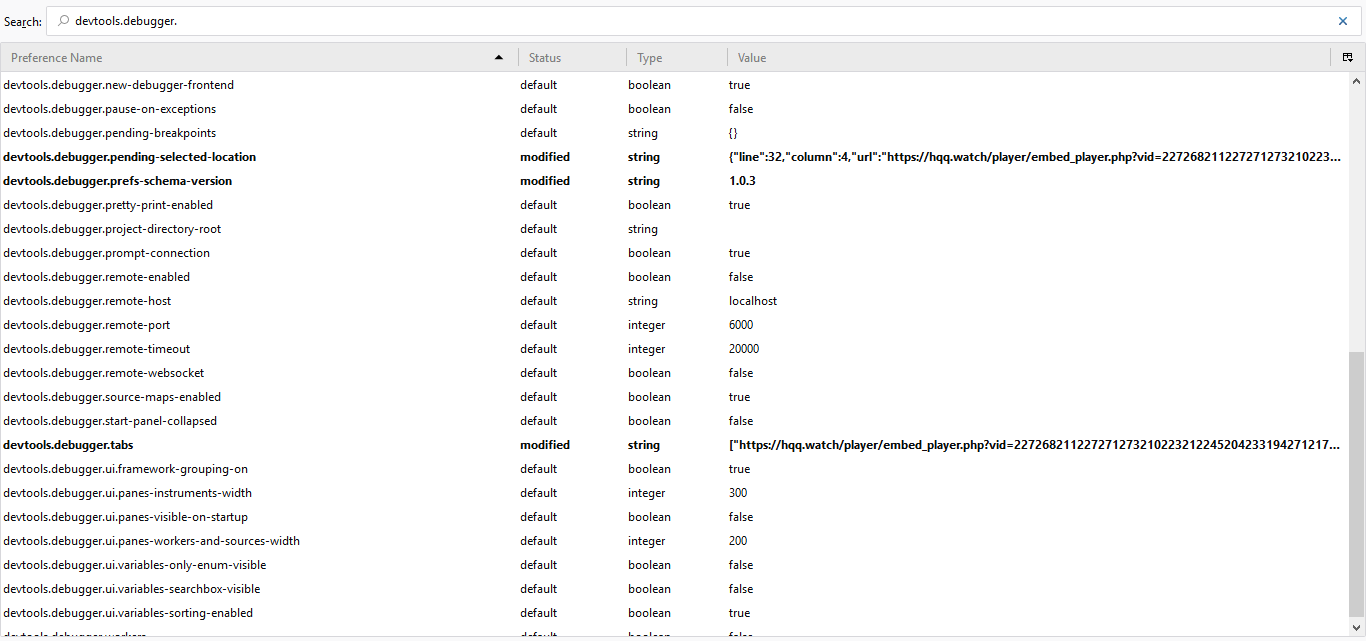
You can check the devtools.debugger.* prefs on the about:config page and reset user set (bold) þat look related via the right-click context menu to the default value.
- devtools.debugger.pause-on-exceptions
You can open the about:config page via the location/address bar. You can accept the warning and click "I accept the risk!" to continue.
Thank you for your answer, cor-el.
Yes, it kind of sounds obvious, but I was not able to find anything in the actual Web Developer Tools to stop that. I went into about:config and here is a screenshot from there.
To keep in mind that this happens on my laptop, desktop, and computer desktop, where I have NOT done any changes in about:config and devtools.debugger.pause-on-exceptions is set to default, false.
Geändert am von greentrancer