How do I control whether the Web Developer Inspector shows the page source instead of just an element's place in the DOM hierarchy?
I find the Inspector (Tools -> Web Developer -> Inspector) very useful. If I can select it and then click on an element in the page, the html markup for that element is shown in the left-hand window of the Inspector tool and the CSS rules that apply are shown in the right-hand window. But from time to time, the left window will just be blank, with a small bar above it showing a set of selectors back from the body tag down to the selected element. The right window is just as functional as usual, but I cannot examine the HTML source for the element. And I can't find any way to get back to what seems to be the default mode, which is what I want.
Any advice about how to avoid getting in this other mode or how to get back if I find myself in that mode?
Thanks.
所有回覆 (1)
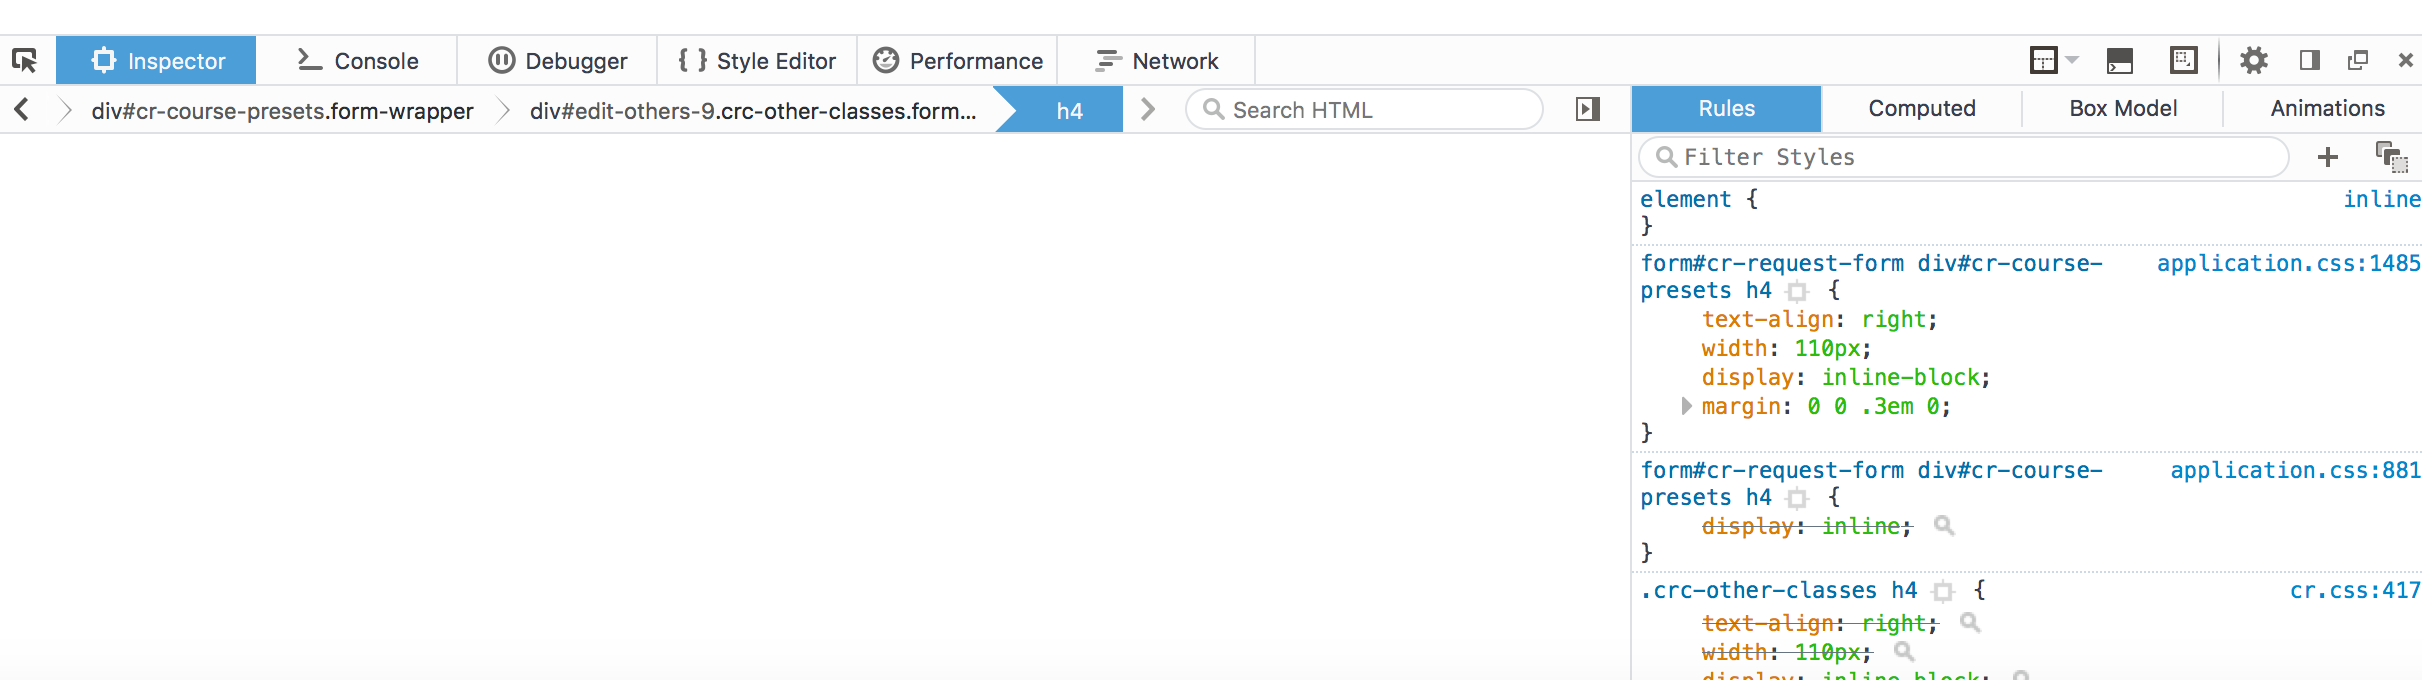
Here's a screenshot of the inspector in the mode I want to get out of.