

How can I debug a 50 second delay on XHR response?
I support a webapp within our company. This webapp has existed for a few years, but it has been exhibiting substantial delays recently Firefox users (I think since update 45).
Here is the sequence of events that I see:
1. Page loads, including the index and many javascript files
2. On load completion, the app takes over and performs two parallel XHR requests
3. The server responds to these requests, but Firefox does not fully process them for 50 seconds
4. After 50 seconds, the response is processed and the webapp proceeds as normal.
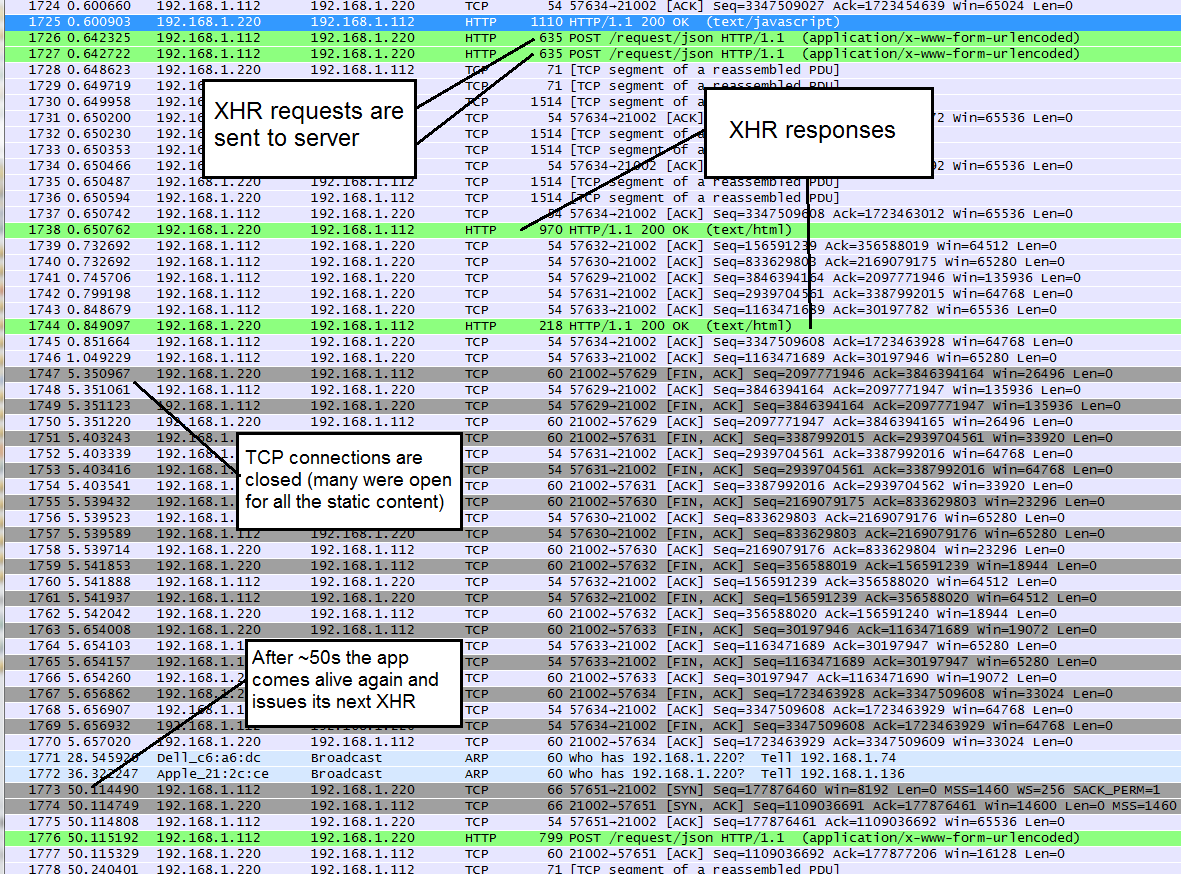
In debugging this, I used both the Firefox developer tools and wireshark to get packet captures. Wireshark shows the two XHR requests being sent on two connections that were previously used to fetch static content. Both of these requests are returned to the PC running Firefox within about 200ms.
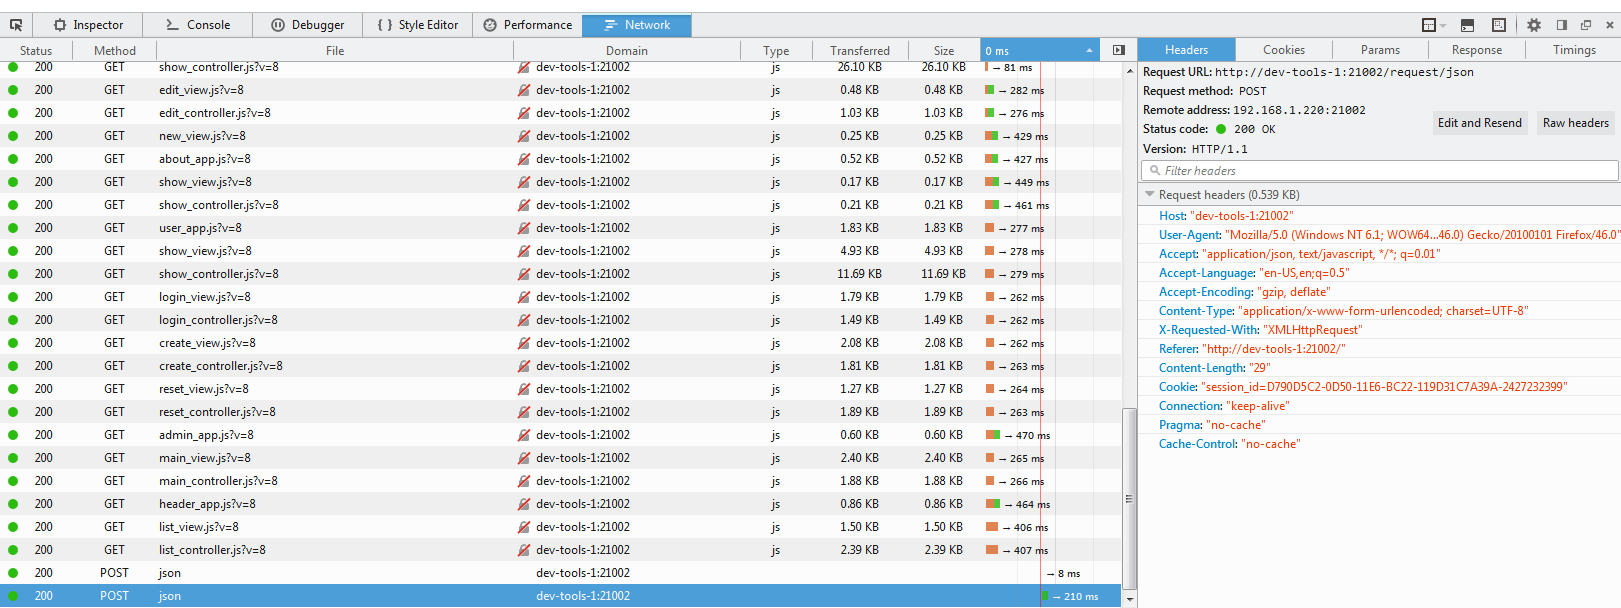
I then looked at the developer tools that displays the network activity. I could see the two XHR requests and both of them showed as being completed (i.e. they were listed with their latency displayed and weren't 'pending'). I clicked on them and, interestingly, they both showed the status code (200 OK), but did not have any response information: no headers or response content. After 50s that content was available in the developer tools display.
One other thing to mention is that while I don't really know the trigger to make this happen, it does only seem to happen when the page is loading the static content. If that content is cached, the problem appears to not happen. With that said, the problem is quite rare and I can't make it occur at will.
At this point, I believe that Firefox is in error. Chrome seems to work fine with this webapp.
Could anyone suggest any additional debugging that I could do on this so that I can get sufficient info to raise a bug for this problem?
Note that I have added some images to show the flow of packets and show the Firefox developer tools during the problem and after the problem. While the problem is going on, you can see that the XHR has completed, but the response information is not present in the right panel. In the second dev-tools image, the request eventually fully completes in Firefox and the response is displayed.

efunneko tarafından tarihinde düzenlendi
Tüm Yanıtlar (1)
Hi, this is covered in more detail in bug 1269055 (https://bugzilla.mozilla.org/show_bug.cgi?id=1269055) and it seems to be a problem for certain non-standard server configurations (Possibly with ngnix 1.10) and Firefox 46. The issue is now fixed in Firefox 47, which is planned to release on June 7. But, you can fix this issue now, with this workaround:
Here's a suggestion from our developers for a workaround: Adjust your server side persistent connection timeout to be about 5 seconds longer than the firefox value. Firefox uses 115 seconds for HTTP/1.x and 180 seconds for HTTP/2.
Hope that helps. If you try it, please let us know the result.