Debugging content scripts on a temporary extension.
I'm porting a chrome extension to firefox: it clearly loads on the page as I see some of it working. But other things are not happening. There are no errors in either the page or the background page. So I wanted to set a breakpoint in my content page, and I followed the instruction on this page: https://extensionworkshop.com/documentation/develop/debugging/#debugging-content-scripts Which clearly shows extensions icons in the Sources/Main Thread.
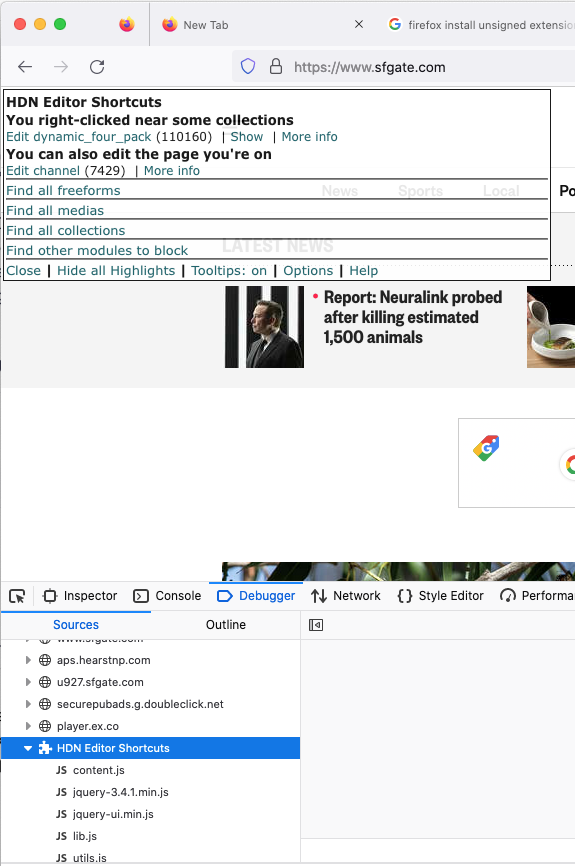
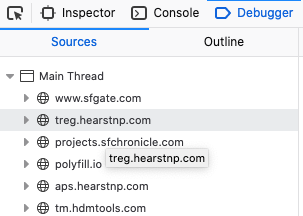
But for me, there are none. The first screenshot is from the page where the extension is loaded no extension is listed, the second is from the background page for the temporary extension.
All Replies (9)
Adding: my chrome extension is a manifest V3 (I just ported it from V2 to V3) and I realize now that firefox does not support manifest V3. As a minimal experiment, I copied my old V2 manifest (but the rest of the extension is the new V3) and the extension does load, but still no way to get to the code in the dev window.
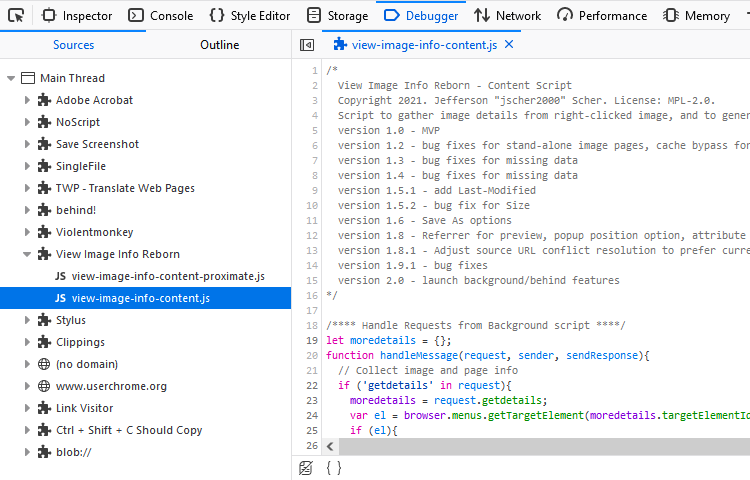
Does the content script show up in the page-level debugger? I don't know whether I modified a setting in order to be able to see these:

Maybe this one?

Question what Chrome extensions are you talking about here? And did you also contact the developer if it's not you if they have a Firefox version or how to enable it on Firefox?
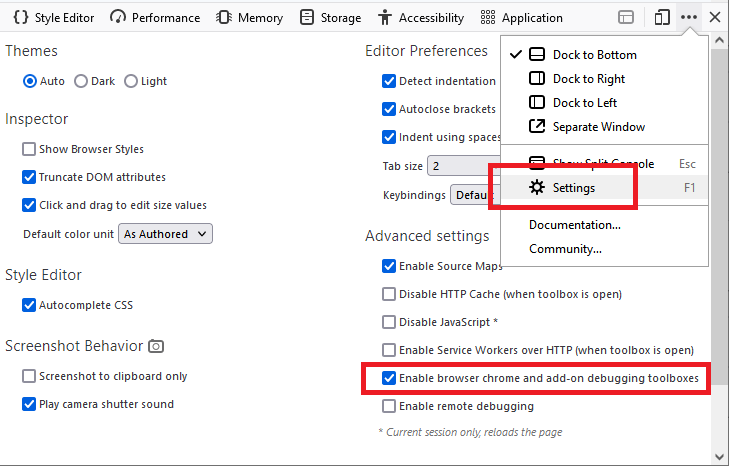
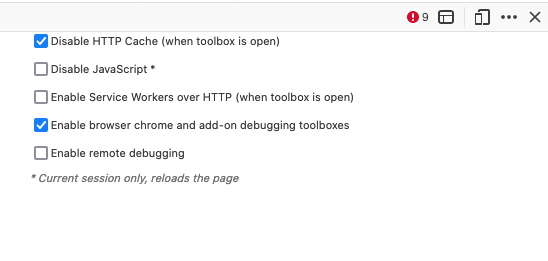
It's my chrome extension. I'm the developer. I did check the "enable browser chrome and add-on debugging toolbox" as suggested by @jscher2000 and still no "puzzle" icons that his screenshot show.
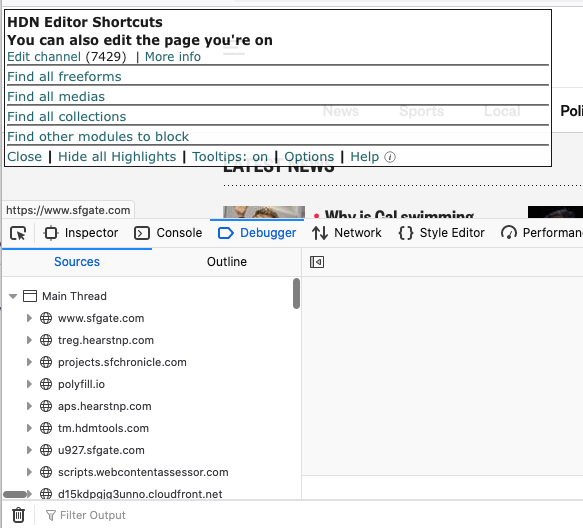
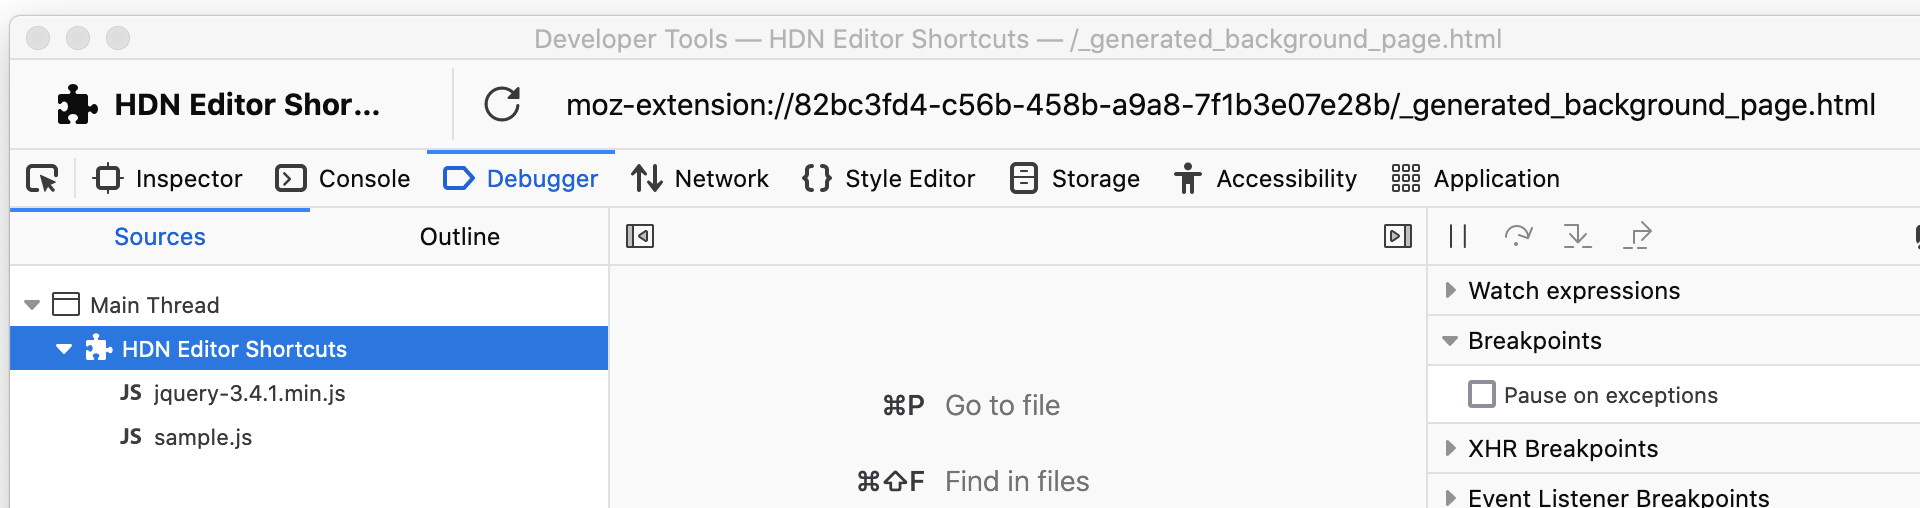
Note that in the background inspect, the extension does show up, but that's not where I need it: I need it where the content scripts are loaded.
Do any other add-on content scripts appear in the page-level Debugger, or none at all?
@jscher2000, thanks for your help. I was pleasantly surprised that my extension seemed to work pretty well in Firefox, and was looking forward to debugging whatever did not. I installed another extension (Basic JSON formatter.) Now my This Firefox tab (by the way, 107.0.1) shows my temporary extension and two installed signed extensions: the System theme - auto (which I assume is built-in) and the {} Basic Json Formatter.
But the page on which my extension loads still does not show any puzzle tile icon or anything that from any of the three extension GUIDs.
Some update for everyone who helped. I'm pretty sure that I had tried to just restart Firefox. But in any case yesterday Firefox hung and I forced quit it. When I restarted it today if said it could restore my pages and so I started a new session.
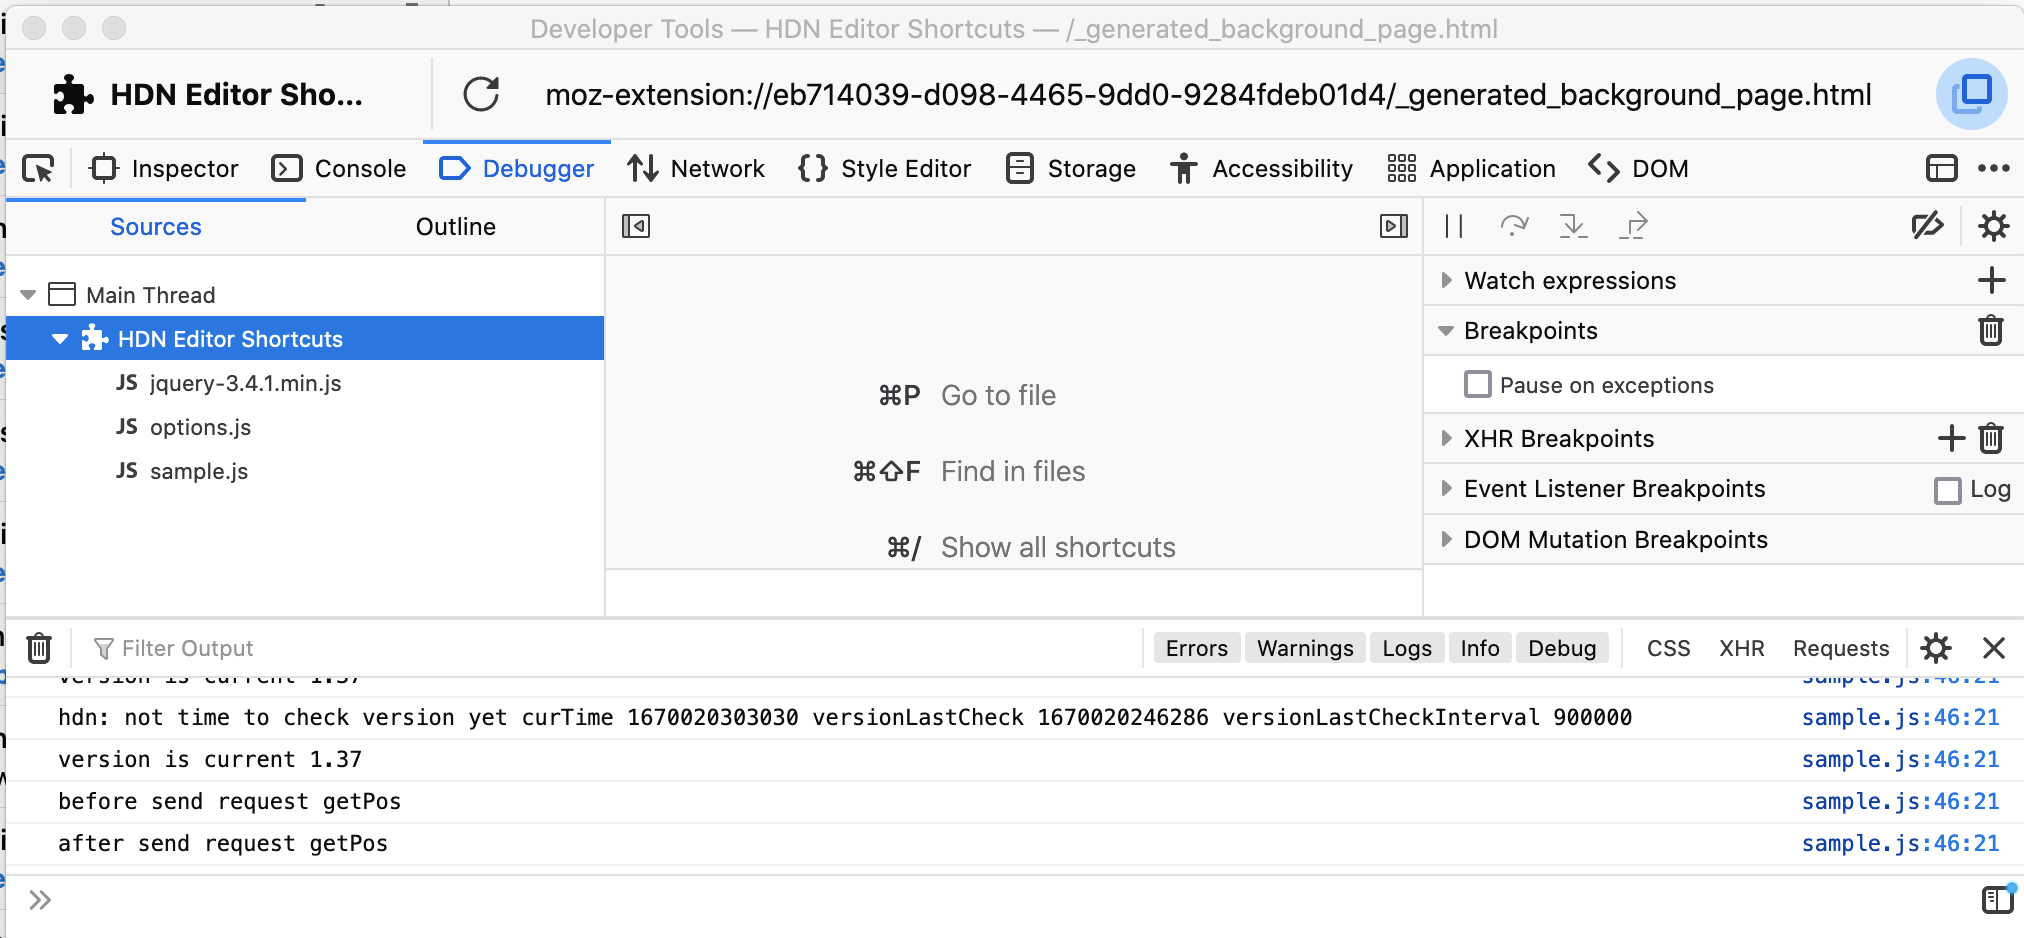
The temporary extension was gone. I reloaded it, opened a page covered by the extension and the puzzle icon is now showing up.