

FireFox Screen Turning Black After Set Time/RAM Used
Hi,
My question is in regards to graphics. This has been going on for several months now and it's getting to the point where it's beginning to eat away at me.
I've recently (within 6 months) installed an additional 16GB of RAM and a new GPU. I upgraded from an ATI Radeon HD 5750 to a Gigabyte Radeon R9 270x. I never had this issue with my 5750 card, so this initially led me to believe it was a card issue, until I discovered that my problem appears to be ONLY with FireFox.
Now to the issue: Upon reaching 2.8GB+ of used memory (according to Task Manager), FireFox flashes for a brief moment and upon scrolling the screen or switching tabs, turns completely black, forcing me to re-load the browser. Now the first issue of FireFox using so much RAM to begin with is insane, and I've tried lowering settings, disabling extensions, all sorts of stuff, and the only thing doing that does is prolong the time before the flash makes its annoying appearance.
The screen flashing issue seems to be something else entirely. I have tried updating to the latest version of FireFox, running a fresh install of FireFox, updating my Graphics Drivers to their latest versions, pretty much anything I can think of, and nothing seems to fix it. What seems to be the deal here? I'd greatly appreciate any feedback and insight into how I can solve this issue aside from flat out using a different web browser.
Physical specifications: ASUS P6X58D Motherboard Intel i7 930 @2.8GHz Processor 22GB Total RAM (3 sticks of 2 and 2 sticks of 8) Gigabyte Radeon R9 270x GPU Unknown Make/Model 850W Power Supply (Honestly I'm simply too lazy to dismantle the top of my tower which is stuffed away in a closed drawer to figure out the make/model at time of posting)
nicholasw2k দ্বারা পরিমিত
সমাধান চয়ন করুন
Running FireFox in safe mode seems to have solved or at least slowed the excessive RAM issue however FireFox now has terrible performance much sooner. Adding in constant freezes and scripts constantly crashing, it would appear that the addons and extensions I was running were helping to solve those issues.
What I'll do now is reload standard firefox and turn my extensions on one by one to see which one seems to be causing the most spikes in ram usage.
AdBlock Plus so far seems to be keeping FireFox stable no problem. Going to turn on my toolbar next. Will edit this post with further information after observing FireFox's behavior.
Edit: Reason to believe it's my toolbar as with AdBlock plus, FireFox was remaining at around or under 1GB of used Physical RAM. After re-enabling my toolbar I've jumped up to 2GB. Will be contacting the toolbar developer soon.
প্রেক্ষাপটে এই উত্তরটি পড়ুন। 👍 0All Replies (11)
First: Please update your plugins to the latest version. Check to make sure you are up to date:
If you see any issues also see:
Second: you might try the beta version of Firefox. Black screen usually indicates graphics, however there are also tools created:
For example:
- https://addons.mozilla.org/en-US/fire.../about-addons-memory/
- Ramback as well
Disabling hardware acceleration in Firefox is another work around: Try disabling graphics hardware acceleration. Since this feature was added to Firefox, it has gradually improved, but there still are a few glitches.
You might need to restart Firefox in order for this to take effect, so save all work first (e.g., mail you are composing, online documents you're editing, etc.).
Then perform these steps:
- Open Firefox Options window (Preferences on Mac or Linux) as follows:
- In Firefox 29.0 and above, click the menu button
 and select Options for Windows or Preferences on Mac or Linux.
- In Firefox 28.0 and previous versions, click the orange Firefox button at the top left, then select the "Options" button, or, if there is no Firefox button at the top, go to Tools > Options.
- In Firefox 29.0 and above, click the menu button
- In the Firefox Options (or Preferences) window, click the Advanced tab, then select General.
- In the settings list, you should find the Use hardware acceleration when available checkbox. Uncheck this checkbox.
- Now, restart Firefox and see if the problems persist.
Additionally, please check for updates for your graphics driver by following the steps mentioned in the following Knowledge base articles:
Did this fix your problems? Please report back to us!
Thank you.
As this takes a while to reproduce, it will be a few days before my next response, however I wanted to update on some information.
- The only plugin I had enabled that was out of date was silverlight, and that has since been updated.
- Upon disabling hardware acceleration previously, that sort of fixed the problem. It allowed my browser to remain somewhat functional but disabled any video content I tried to load immediately.
Beyond that, if the problem persists after updating silverlight and disabling hardware acceleration once again, I'll check out Ramback and see if that solves my issue. If it persists further, I'll update this post again with additional information.
Thanks!
These steps have solved the black screen issue, however have not solved the high RAM usage and eventual malfunction of firefox issue.
Even after using Ramback, Task Manager showed FireFox still using upwards of 3GB of my physical memory.
It's entirely possible that this is an ongoing issue and may never end up solved, but the point was to bring it to Mozilla Support's attention, which I have done for the time being.
If you have further steps for me to try to reduce or reset the amount of physical memory that FireFox is using after several hours of idle use, feel free to reply. Thanks for solving my black screen issue :)
I retract my previous statement as I've just had the black screen come back after hitting 3.0GB of physical memory used according to Task Manager. Please see previous post for more questions.
Hi nicholasw2k, Thank you for your responses. Would you mind sharing the drivers you have for the computer's ram?
webglRenderer: Google Inc. -- ANGLE (AMD Radeon R9 200 Series Direct3D9Ex vs_3_0 ps_3_0)
Let's make sure they are both up to date and that this is correct, black screen was a past issue and updating the drivers solved some, but not all.
Hi guigs2,
I am running driver version 14.501.1003.0 for Windows 7 Ultimate as my Graphics Driver. I made an attempt to update before posting this as a "just in case" type of deal and I'm already up to date on my graphics drivers.
The card specifically is a Gigabyte Radeon R9 270x
I would only say its the ram if its also not working in other browsers. Since it is only happening with Firefox, and you already mentioned the type in your question description (apologies for missing this).
We can try another angle, perhaps a memory report. It can show what is useing the most memory in Firefox: about:memory https://developer.mozilla.org/en-US/d.../about%3Amemory
I tried other references to memory caps to try to find the peak memory where Firefox starts to panic as you are seeing in the graphics barf.
- http://kb.mozillazine.org/Talk:Reducing_memory_usage_-_Firefox...
- various addons for video performance also started
Please also make sure that it does not happen in Safe Mode (to eliminate an add on being an issue)Diagnose Firefox issues using Troubleshoot Mode
When it's nearing the point of no return I'll run a memory report and paste the contents here. After that I'll run FF in safemode and see what happens then. Will report back if it happens even in safe mode. If it doesn't then I'll mark this as resolved and figure out which of my addons is causing it.
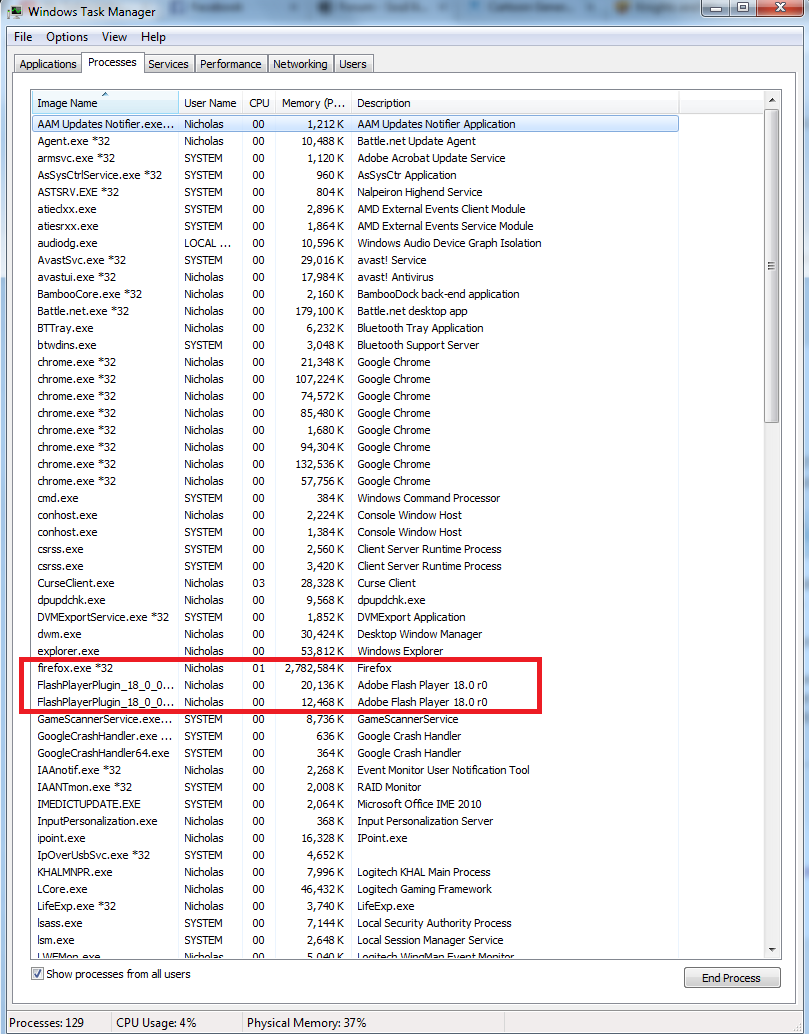
Edit: In the next post is the memory report taken when task manager looks as described in the attached image in this post. Some links were changed slightly to keep information private (i.e. in facebook.com/<user information goes here> , the user information has been removed).
nicholasw2k দ্বারা পরিমিত
Main Process Explicit Allocations
806.90 MB (100.0%) -- explicit ├──282.99 MB (35.07%) -- window-objects │ ├───90.47 MB (11.21%) -- top(https://twitter.com/, id=169) │ │ ├──57.93 MB (07.18%) -- active │ │ │ ├──57.44 MB (07.12%) -- window(https://twitter.com/) │ │ │ │ ├──23.91 MB (02.96%) -- js-compartment(https://twitter.com/) │ │ │ │ │ ├──21.88 MB (02.71%) -- classes │ │ │ │ │ │ ├──12.48 MB (01.55%) ++ (22 tiny) │ │ │ │ │ │ └───9.39 MB (01.16%) ++ class(Object) │ │ │ │ │ └───2.04 MB (00.25%) ++ (7 tiny) │ │ │ │ ├──16.88 MB (02.09%) -- dom │ │ │ │ │ ├───8.55 MB (01.06%) ── orphan-nodes │ │ │ │ │ └───8.33 MB (01.03%) ++ (5 tiny) │ │ │ │ ├──13.16 MB (01.63%) ++ layout │ │ │ │ └───3.49 MB (00.43%) ++ (2 tiny) │ │ │ └───0.50 MB (00.06%) ++ window(about:blank) │ │ └──32.54 MB (04.03%) -- js-zone(0x24205000) │ │ ├──17.75 MB (02.20%) ++ strings │ │ ├──11.86 MB (01.47%) ── unused-gc-things │ │ └───2.92 MB (00.36%) ++ (6 tiny) │ ├───57.31 MB (07.10%) -- top(https://www.facebook.com/, id=55) │ │ ├──31.42 MB (03.89%) -- active │ │ │ ├──26.40 MB (03.27%) -- window(https://www.facebook.com/) │ │ │ │ ├──16.29 MB (02.02%) -- js-compartment(https://www.facebook.com/) │ │ │ │ │ ├──14.59 MB (01.81%) ++ classes │ │ │ │ │ └───1.71 MB (00.21%) ++ (7 tiny) │ │ │ │ └──10.10 MB (01.25%) ++ (4 tiny) │ │ │ └───5.02 MB (00.62%) ++ (2 tiny) │ │ └──25.89 MB (03.21%) -- js-zone(0xee0c800) │ │ ├──21.32 MB (02.64%) ── unused-gc-things │ │ └───4.57 MB (00.57%) ++ (7 tiny) │ ├───44.63 MB (05.53%) -- top(http://sar-soulasylum.enjin.com/forum, id=65) │ │ ├──37.06 MB (04.59%) -- active │ │ │ ├──19.97 MB (02.47%) -- window(http://sar-soulasylum.enjin.com/forum) │ │ │ │ ├──12.04 MB (01.49%) -- js-compartment(http://sar-soulasylum.enjin.com/forum) │ │ │ │ │ ├──11.23 MB (01.39%) ++ classes │ │ │ │ │ └───0.81 MB (00.10%) ++ (6 tiny) │ │ │ │ └───7.93 MB (00.98%) ++ (4 tiny) │ │ │ └──17.10 MB (02.12%) ++ (7 tiny) │ │ └───7.57 MB (00.94%) ++ js-zone(0x1d162c00) │ ├───30.41 MB (03.77%) ++ (11 tiny) │ ├───19.41 MB (02.41%) -- top(https://www.youtube.com/feed/subscriptions, id=8) │ │ ├──16.40 MB (02.03%) -- active │ │ │ ├───9.70 MB (01.20%) ++ window(https://www.youtube.com/feed/subscriptions) │ │ │ └───6.70 MB (00.83%) ++ (3 tiny) │ │ └───3.01 MB (00.37%) ++ js-zone(0x19c2c400) │ ├───14.35 MB (01.78%) -- top(none)/detached │ │ ├──10.51 MB (01.30%) -- window(chrome://browser/content/browser.xul) │ │ │ ├───8.65 MB (01.07%) ++ js-compartment([System Principal], about:blank) │ │ │ └───1.86 MB (00.23%) ++ (3 tiny) │ │ └───3.84 MB (00.48%) ++ (5 tiny) │ ├───13.84 MB (01.72%) -- top(chrome://browser/content/browser.xul, id=3) │ │ ├───9.00 MB (01.12%) -- active │ │ │ ├──8.60 MB (01.07%) ++ window(chrome://browser/content/browser.xul) │ │ │ └──0.40 MB (00.05%) ++ (2 tiny) │ │ └───4.84 MB (00.60%) ++ js-zone(0xf406c00) │ └───12.55 MB (01.56%) -- top(http://deviantart.com/, id=181) │ ├───9.89 MB (01.23%) -- active │ │ ├──9.74 MB (01.21%) ++ window(http://deviantart.com/) │ │ └──0.15 MB (00.02%) ++ window(about:blank) │ └───2.66 MB (00.33%) ++ js-zone(0x32048c00) ├──155.74 MB (19.30%) -- js-non-window │ ├───81.28 MB (10.07%) -- zones │ │ ├──62.24 MB (07.71%) -- zone(0x2592000) │ │ │ ├──35.52 MB (04.40%) ++ (287 tiny) │ │ │ └──26.72 MB (03.31%) ++ strings │ │ ├──13.52 MB (01.68%) -- zone(0x258e000) │ │ │ ├──11.72 MB (01.45%) -- strings │ │ │ │ ├──11.61 MB (01.44%) ++ string(<non-notable strings>) │ │ │ │ └───0.10 MB (00.01%) ++ (5 tiny) │ │ │ └───1.80 MB (00.22%) ++ (5 tiny) │ │ └───5.52 MB (00.68%) ++ (23 tiny) │ ├───63.37 MB (07.85%) -- runtime │ │ ├──16.08 MB (01.99%) ── atoms-table │ │ ├──14.52 MB (01.80%) -- gc │ │ │ ├──13.00 MB (01.61%) ── nursery-committed │ │ │ └───1.52 MB (00.19%) ++ (3 tiny) │ │ ├──12.21 MB (01.51%) ++ (9 tiny) │ │ ├──11.12 MB (01.38%) ── script-data │ │ └───9.44 MB (01.17%) ++ code │ └───11.08 MB (01.37%) ++ gc-heap ├──130.58 MB (16.18%) ── heap-unclassified ├───58.61 MB (07.26%) -- heap-overhead │ ├──50.31 MB (06.23%) ── bin-unused │ └───8.31 MB (01.03%) ++ (3 tiny) ├───43.08 MB (05.34%) -- network │ ├──43.08 MB (05.34%) -- cache2 │ │ ├──37.57 MB (04.66%) ── memory-storage(/M) │ │ └───5.50 MB (00.68%) ++ (6 tiny) │ └───0.01 MB (00.00%) ++ (4 tiny) ├───31.52 MB (03.91%) -- add-ons │ ├──18.70 MB (02.32%) -- {d10d0bf8-f5b5-c8b4-a8b2-2b9879e08c5d}/js-non-window/zones/zone(0x2592000)/compartment([System Principal], jar:file:///C:/Users/<User>/AppData/Roaming/Mozilla/Firefox/Profiles/lpg6sobg.default/extensions/%7Bd10d0bf8-f5b5-c8b4-a8b2-2b9879e08c5d%7D.xpi!/bootstrap.js (from: resource://gre/modules/addons/XPIProvider.jsm:4322)) │ │ ├──17.97 MB (02.23%) -- classes │ │ │ ├──11.60 MB (01.44%) ++ class(Object) │ │ │ └───6.37 MB (00.79%) ++ (8 tiny) │ │ └───0.74 MB (00.09%) ++ (7 tiny) │ ├──12.42 MB (01.54%) ++ {a8864317-e18b-4292-99d9-e6e65ab905d3} │ └───0.40 MB (00.05%) ++ (2 tiny) ├───29.80 MB (03.69%) -- images │ ├──26.86 MB (03.33%) -- content/raster │ │ ├──26.84 MB (03.33%) ++ used │ │ └───0.02 MB (00.00%) ++ unused/<non-notable images> │ └───2.94 MB (00.36%) ++ (2 tiny) ├───26.06 MB (03.23%) -- gfx │ ├──19.75 MB (02.45%) ── heap-textures │ └───6.31 MB (00.78%) ++ (5 tiny) ├───15.59 MB (01.93%) ++ (15 tiny) ├───12.46 MB (01.54%) -- storage │ ├───9.87 MB (01.22%) ++ sqlite │ └───2.59 MB (00.32%) ++ prefix-set ├───10.42 MB (01.29%) ++ workers/workers(chrome) └───10.04 MB (01.24%) -- layout
   ├───9.76 MB (01.21%) ── style-sheet-service
   └───0.28 MB (00.03%) ── style-sheet-cache
Other Measurements
4,095.94 MB (100.0%) -- address-space ├──3,184.16 MB (77.74%) -- commit │ ├──2,847.96 MB (69.53%) -- private │ │ ├──2,823.12 MB (68.92%) ── readwrite [2888] │ │ └─────24.84 MB (00.61%) ++ (6 tiny) │ ├────197.37 MB (04.82%) -- image │ │ ├──109.46 MB (02.67%) ── execute-read [180] │ │ ├───79.34 MB (01.94%) ── readonly [395] │ │ └────8.57 MB (00.21%) ++ (3 tiny) │ └────138.83 MB (03.39%) -- mapped │ ├───90.25 MB (02.20%) ── readonly [56] │ ├───47.81 MB (01.17%) ── readwrite [65] │ └────0.77 MB (00.02%) ++ (2 tiny) ├────499.32 MB (12.19%) ── free [661] └────412.45 MB (10.07%) -- reserved
    ├──382.37 MB (09.34%) ── private [2123]
    └───30.08 MB (00.73%) ++ (2 tiny)
46.84 MB (100.0%) -- decommitted ├──44.91 MB (95.90%) -- js-non-window │ ├──41.91 MB (89.49%) ── gc-heap/decommitted-arenas │ └───3.00 MB (06.41%) ── runtime/gc/nursery-decommitted └───1.92 MB (04.10%) -- workers/workers(chrome)
   ├──0.70 MB (01.48%) -- worker(resource:///modules/sessionstore/SessionWorker.js, 0x1621a800)
   │  ├──0.70 MB (01.48%) ── gc-heap/decommitted-arenas
   │  └──0.00 MB (00.00%) ── runtime/gc/nursery-decommitted
   ├──0.64 MB (01.38%) -- worker(resource://gre/modules/PageThumbsWorker.js, 0xda9e400)
   │  ├──0.64 MB (01.38%) ── gc-heap/decommitted-arenas
   │  └──0.00 MB (00.00%) ── runtime/gc/nursery-decommitted
   └──0.58 MB (01.24%) -- worker(resource://gre/modules/osfile/osfile_async_worker.js, 0xe2c8c00)
      ├──0.58 MB (01.24%) ── gc-heap/decommitted-arenas
      └──0.00 MB (00.00%) ── runtime/gc/nursery-decommitted
9,406 (100.0%) -- event-counts ├──9,383 (99.76%) -- window-objects │ ├──2,794 (29.70%) -- top(none)/detached │ │ ├──2,618 (27.83%) ── window(chrome://browser/content/browser.xul)/dom/event-listeners [4] │ │ ├────167 (01.78%) ── window(chrome://browser/content/places/places.xul)/dom/event-listeners │ │ └──────9 (00.10%) ── window(https://twitter.com/i/cards/tfw/v1/613359197753774080?advertiser_name=Visa&cardname=promo_website&is_following_advertiser=false&forward=true&impression_id=575442ef09fb8d4b#xdm_e=https%3A%2F%2Ftwitter.com&xdm_c=default1114&xdm_p=1)/dom/event-listeners │ ├──2,025 (21.53%) -- top(chrome://browser/content/browser.xul, id=3)/active │ │ ├──1,984 (21.09%) -- window(chrome://browser/content/browser.xul)/dom │ │ │ ├──1,977 (21.02%) ── event-listeners │ │ │ └──────7 (00.07%) ── event-targets │ │ └─────41 (00.44%) ++ (2 tiny) │ ├──1,351 (14.36%) -- top(https://twitter.com/, id=169)/active │ │ ├──1,342 (14.27%) -- window(https://twitter.com/)/dom │ │ │ ├──1,323 (14.07%) ── event-listeners │ │ │ └─────19 (00.20%) ── event-targets │ │ └──────9 (00.10%) ── window(about:blank)/dom/event-targets [9] │ ├────987 (10.49%) -- top(https://www.facebook.com/, id=55)/active │ │ ├──979 (10.41%) -- window(https://www.facebook.com/)/dom │ │ │ ├──943 (10.03%) ── event-listeners │ │ │ └───36 (00.38%) ── event-targets │ │ └────8 (00.09%) ++ (2 tiny) │ ├────566 (06.02%) -- top(http://www.knightsandmerchants.net/forum/index.php?sid=73cb91a33bbe2b243d95868557dd23b1, id=163)/active/window(http://www.knightsandmerchants.net/forum/index.php?sid=73cb91a33bbe2b243d95868557dd23b1)/dom │ │ ├──546 (05.80%) ── event-listeners │ │ └───20 (00.21%) ── event-targets │ ├────398 (04.23%) -- top(https://www.youtube.com/feed/subscriptions, id=8)/active │ │ ├──311 (03.31%) -- window(https://www.youtube.com/feed/subscriptions)/dom │ │ │ ├──309 (03.29%) ── event-listeners │ │ │ └────2 (00.02%) ── event-targets │ │ └───87 (00.92%) ++ (3 tiny) │ ├────324 (03.44%) -- top(http://www.cartoongenerals.com/main/index.php?/index, id=158)
চয়ন করা সমাধান
Running FireFox in safe mode seems to have solved or at least slowed the excessive RAM issue however FireFox now has terrible performance much sooner. Adding in constant freezes and scripts constantly crashing, it would appear that the addons and extensions I was running were helping to solve those issues.
What I'll do now is reload standard firefox and turn my extensions on one by one to see which one seems to be causing the most spikes in ram usage.
AdBlock Plus so far seems to be keeping FireFox stable no problem. Going to turn on my toolbar next. Will edit this post with further information after observing FireFox's behavior.
Edit: Reason to believe it's my toolbar as with AdBlock plus, FireFox was remaining at around or under 1GB of used Physical RAM. After re-enabling my toolbar I've jumped up to 2GB. Will be contacting the toolbar developer soon.
nicholasw2k দ্বারা পরিমিত
(delayed response) I took a look again at your troubleshooting information and there was an add on that may have been updated since the beginning of this thread, at least the signed version "Released May 3, 2014 ":
I am still learning how to read these reports but it looks like the window/.xul is another name for the Firefox interface.
"│ │ ├──1,984 (21.09%) -- window(chrome://browser/content/browser.xul)/dom"
But mine was about 50% with 7 windows that have been open all week -mac 10.10 on beta. It looks like it breaks down for each window how much memory Firefox is using or the "browser.xul"
In conclusion still it seems that your method is best for troubleshooting, trial and error. I would be happy to learn anymore you might have discovered.
If there are more issues, there is another work around: try a new profile.
EDIT: as a follow up, we can also file a bug if assistance is needed
guigs দ্বারা পরিমিত